


Ever wonder if a simple chart pattern can lead you to a winning trade? Technical analysis takes everyday price swings and turns them into smart strategies. It’s like following a map drawn from past market tales, each candlestick reveals a hint of buyer strength. Instead of wading through bulky reports, traders lean on clear charts to recognize familiar market moods. Today, we'll dive into strategies that show how past trends can steer your future moves and turn basic data into confident action.
Fundamental Principles of Technical Analysis for Trading
Technical analysis is all about using charts and volume trends to predict where prices might go next. Instead of digging into news and financial reports like fundamental analysis does, it leans on past price data to get a feel for the market. Imagine a trader looking at a candlestick chart and noticing a long lower wick, this might mean strong buyers are stepping in. Basically, past price moves give clues about future trends.
This approach rests on a few main ideas. First, the current price already shows everything that might affect it. Second, prices move in trends that often repeat themselves. And finally, the patterns we see on charts come from human emotions like fear and greed. It’s almost like reading a story where the same feelings drive each chapter.
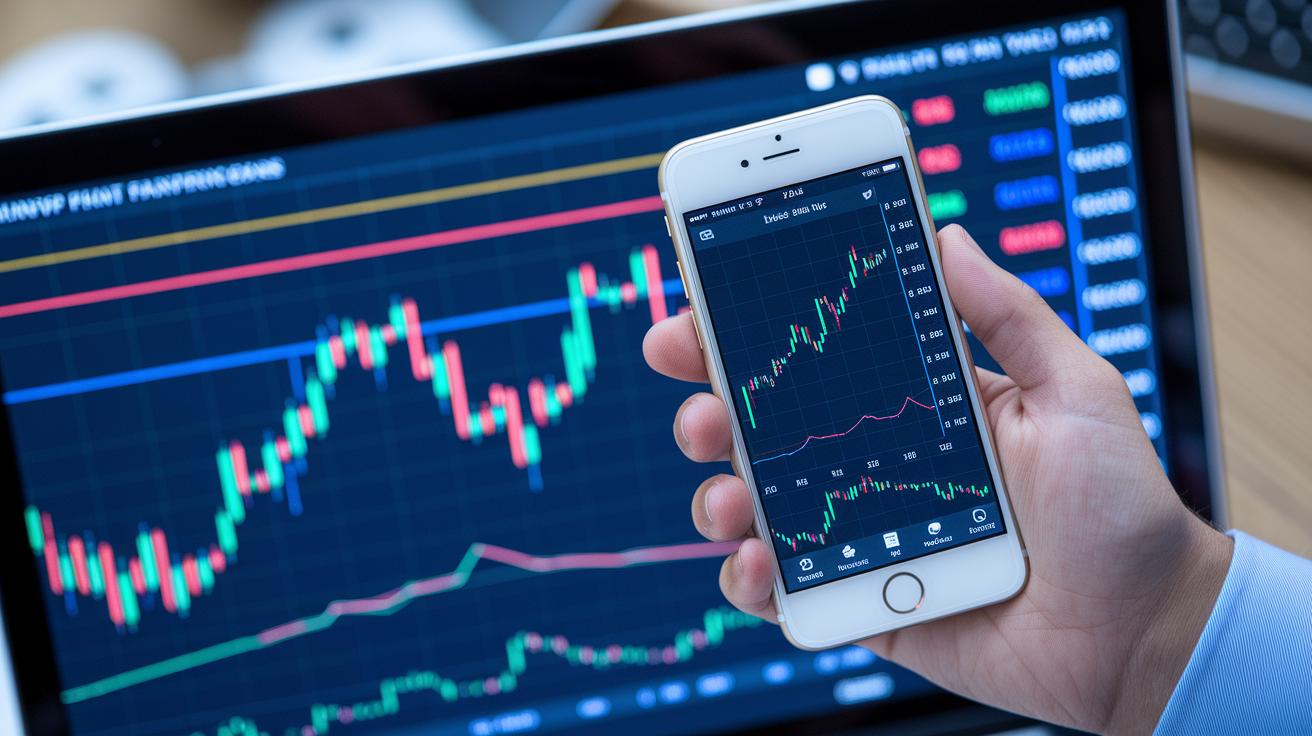
Traders use simple tools to make sense of these ideas. They turn to candlestick charts for a clear picture, draw support and resistance lines from past highs and lows, and use trendlines to connect key price points. Platforms like MetaTrader 4 bring all these tools into one view, helping traders decide when to buy or sell. This hands-on method offers a real-time edge over approaches that only focus on the news.
Essential Technical Indicators for Trading
Moving Average takes a bunch of price data and smooths it out so you can see the overall trend. When prices cross above a 50-day MA, it might be a hint that the market is starting to rise, almost like the price is stepping into a new chapter.
The MACD indicator compares two exponential moving averages to give clear buy or sell signs. When its line goes above the signal line, many traders see it as a green light to buy. Conversely, if it dips below, it could be time to sell. Think of it like a simple test for the market’s mood.
RSI tells you how quickly prices swing up or down. When the RSI gets too high, it might mean the market is getting overexcited and could pull back soon. Did you know? An RSI above 70 might suggest traders are overdoing it, kind of like when summer gets too hot and a cool breeze is needed.
Volume indicators check if a price move is backed by strong trading activity. If prices go up and the volume is rising too, it can mean the move is solid. It’s a bit like hearing a smooth tune and also feeling the beat that drives it.
Fibonacci retracements use special numbers like 38.2%, 50%, and 61.8% to point out potential support and resistance spots. When prices pull back to one of these levels, it might be a smart time to jump back into a trade, like finding a familiar stepping stone on a winding path.
Together, these tools build a strong technical trading strategy. Each one adds a bit of insight, helping you see market moves more clearly and spot potential opportunities.
Mastering Candlestick Pattern Recognition in Trading
Candlestick charts give you a quick snapshot of open, high, low, and close prices all at once. They help you get a feel for the market's mood by displaying patterns that hint at possible trends, either continuing or reversing. Spotting these patterns can really change the game for traders looking for clear signals.
Single-candle patterns act like little mood rings for the market. Take the bullish Marubozu, for instance, it shows a candle with no lower shadow, which tells you buyers are in charge. The bearish Marubozu works the same way on the sell side, lacking an upper shadow to signal strong selling pressure. Then there are the Doji or Spinning Top patterns. They show moments of indecision where neither side is taking control, and traders might see these as a cue to double-check other signals before jumping in.
When you look at multiple-candle formations, you get an even clearer picture by comparing one candle to the next. For example, in a bullish engulfing pattern, a small candle is followed by a larger one that completely swallows the previous candle, hinting that prices may soon climb. The bearish engulfing pattern is just the reverse, a big red candle takes over a small green one, suggesting a drop might be ahead. Many day traders find these setups handy for pinpointing the best times to get in or exit a trade.
These patterns aren’t just about numbers; they also show the tug-of-war between buyers and sellers. Every formation gives you a glimpse into the market’s feelings. By spotting these subtle changes, you can catch emerging trends or reversals, which might just give you that extra edge during fast trades.
| Pattern Name | Number of Candles | Signal Type | Typical Confirmation |
|---|---|---|---|
| Bullish Marubozu | 1 | Bullish | Strong trend continuation |
| Bearish Marubozu | 1 | Bearish | Trend down confirmation |
| Doji | 1 | Neutral | Requires external trend context |
| Spinning Top | 1 | Neutral | Signals market caution |
| Bullish Engulfing | 2 | Bullish | Break of resistance level |
| Bearish Engulfing | 2 | Bearish | Drop below support level |
Chart Patterns and Trendlines in Technical Analysis for Trading
Support and resistance levels are like hidden checkpoints on a chart. They’re drawn at the points where prices previously turned, acting like invisible barriers that can make prices bounce back. Trendlines, which connect a series of highs or lows, help you see the market’s overall direction. For example, an upward trendline might show a steady rise, while a downward one hints at a falling market.
Chart patterns add another layer of insight. Triangles, whether they’re ascending, descending, or symmetrical, often hint that the market is pausing before making a big move. A head and shoulders pattern, which features one tall peak followed by two smaller ones, can signal that an established trend might be about to reverse. Flags and rectangles, on the other hand, suggest short breaks where prices might keep on their current path or change course.
Price gaps also offer useful clues. These gaps are spots on the chart where no trading happens, and they can point to trading opportunities. A breakaway gap might mark the start of a new trend, a runaway gap can amplify an ongoing move, and an exhaustion gap may suggest that a price surge is running out of steam.
By using these simple geometric ideas, traders can better spot potential breakouts or reversals and set clear targets for when to enter or exit the market.
Applying Technical Analysis Strategies in Live Trading
Crafting a Trading Plan
Before you jump into live trading, it’s smart to start with a clear plan. Think of it like mapping out a fun road trip. First, set simple trading goals and pick a market that suits your style. For example, if you prefer steady moves, you might choose EUR/CHF because it doesn’t swing too wildly. Then, decide on a chart timeframe that fits your trading style, whether you're in for quick, day-by-day moves or a slower swing trade. And, just like planning your route on a road trip, pinpoint where you’ll enter and exit the trade by marking key support and resistance levels.
Entry and Exit Techniques
Now, let’s talk about when to jump in or step out. It helps to check for signals on different timeframes, maybe you see an interesting pattern on a 15-minute chart, and then the same signal shows up on a 1-hour chart. This kind of cross-check gives you more confidence. Set clear signals for your entry, like when a specific candlestick shape appears or a moving average crosses over. And when it’s time to exit, decide your targets ahead of time or exit if the market hints at turning around. It’s a bit like setting a timer on your cooking, knowing when to take action before things get overdone.
Risk Management Essentials
Every trade comes with some risk, so it’s important to plan for bumps along the way. Use stop losses by placing them just beyond key levels to help keep any losses small if the market moves against you. Also, decide in advance how much of your trading capital you are willing to risk on each trade, think of it as budgeting for a little adventure. Follow max drawdown rules too; if your losses pile up to a certain point, it’s a signal to pause and re-evaluate your strategy. If you’d like to dive a bit deeper into risk management, check out https://dealerserve.com?p=1203 for more info.
Backtesting and Practice
Before you trade with real money, spend some time testing your strategy. Use platforms like MetaTrader 4 to run your plan against past market data. This practice helps you spot any weak points and builds up your confidence. After that, try a paper trading simulator, such as the one at https://cipherstonk.com?p=145, to practice in real time without risking capital. This step-by-step approach gears you up and makes sure you’re ready for live trading.
Leveraging Advanced and Automated Technical Analysis Tools
Modern platforms are totally changing how traders keep an eye on the markets. Tools like TradingView and ChartIQ let you set up custom scripts and alerts that work just the way you want. So if a price dips or climbs past its moving average, you'll get a quick nudge to consider your next move.
Bots work at lightning speed, processing multiple signals in just milliseconds. Imagine a system that picks up even the smallest changes and instantly lets you know about a high-frequency opportunity. It’s like having a friendly assistant who never misses a beat, so you can catch those quick shifts that manual checks might overlook.
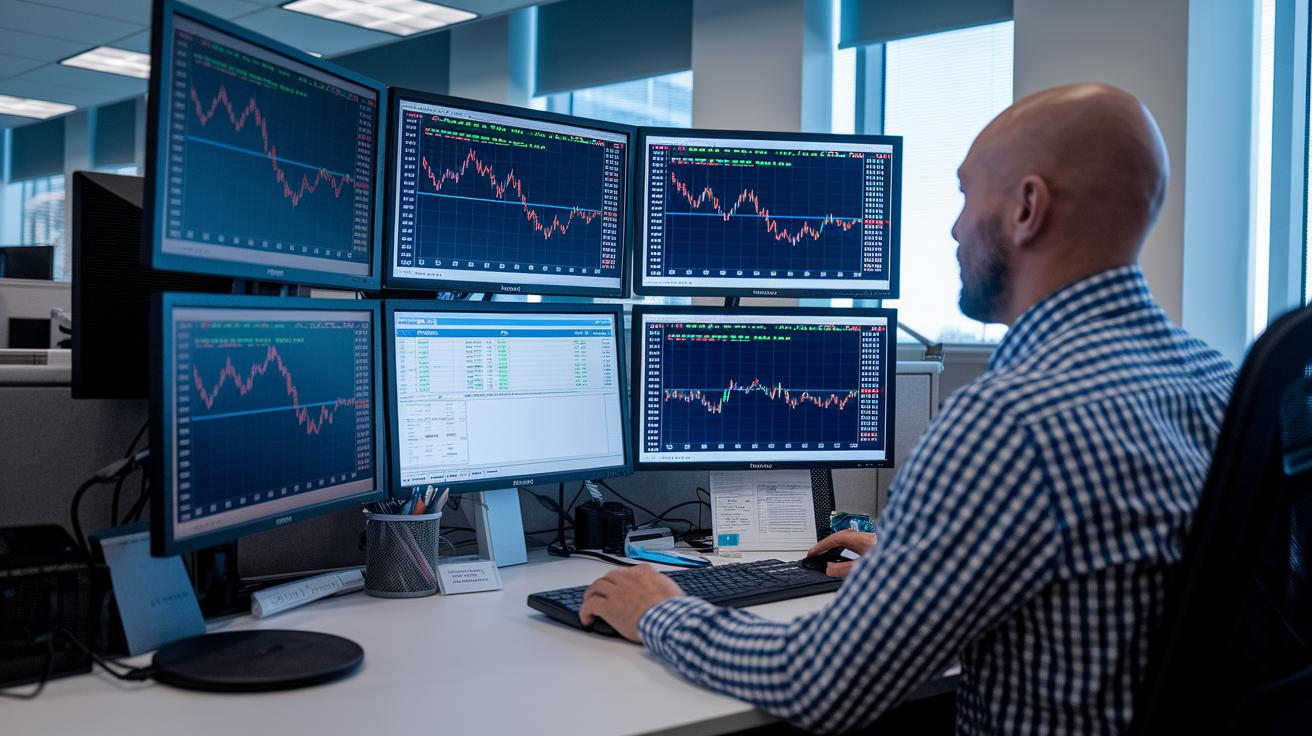
Real-time dashboards gather all the key details, price, volume, indicator readouts, and pivot ranges, in one clear view. Picture a display that shows several data streams at once, giving you that full snapshot to make fast, confident decisions.
When you mix tools like the Central Pivot Range with the ADX indicator, your market readings get even sharper. These advanced, automated signals build a rich picture of market strength, cutting down the guesswork and boosting your strategy’s efficiency. It’s a powerful blend of real-time chart watching and smart automation that gives you a definite edge in a fast-paced market.
Real-World Technical Analysis Case Studies for Trading
Imagine a day trade where technical signals align perfectly. One example shows a EUR/USD moving average (MA) crossover coupled with an RSI that dipped into oversold territory on MetaTrader 4. It was like a sudden flash of insight, when the trend turns, profit follows fast. The moving average hinted at a shift, and the RSI confirmed that the market was set to bounce back. In just 30 minutes, the trader caught a neat 15-pip rally.
Then there’s a swing trade with AAPL. This time, chart patterns and Fibonacci retracement levels played a key role. After a break of a trendline suggested a possible change, the price moved back to the 61.8% Fibonacci level, which is often seen as strong support. Acting on this pattern, the trader made an 8% gain in two weeks. Historical tests of similar patterns even showed a 65% win rate over the past year, proving that well-confirmed setups can lead to strong returns.
Additional tools like ATR (a measure of price volatility) and spikes in trading volume helped further confirm the right entry points. These stories show that when you mix clear technical signals with historical data, complex market moves can be turned into real winning strategies.
Final Words
In the action, we explored core ideas of technical analysis for trading, from chart inspections and key indicators to trendlines, support levels, and risk check methods. We shared clear steps for planning, practicing, and refining trade setups using candlestick patterns and modern tools. Each insight aimed to boost your confidence in today’s dynamic market. Keep using these techniques to sharpen your trading skills and see progress in your investment efforts.
FAQ
Where can I find technical analysis PDFs covering trading and Forex?
Technical analysis PDFs provide comprehensive guides on chart reading, trends, and indicators. They offer accessible examples and methods to study market behavior and support informed trading decisions.
What is a technical analysis example?
A technical analysis example shows how traders study charts, patterns, and indicators to spot trends and set entry or exit points, making market data more actionable.
What are the types of technical analysis?
The types of technical analysis include pattern evaluation, trendline drawing, candlestick interpretation, and indicator mapping. Each method focuses on price movements and trading volume for clear market signals.
What is the technical analysis meaning?
Technical analysis means using past price and volume data to predict future market movements by spotting repeating patterns and trends caused by trader behaviors.
What is a technical analysis strategy?
A technical analysis strategy combines chart patterns, moving averages, and other indicators to define entry and exit signals, helping traders manage risks and spot trade opportunities.
Which technical analysis method is best for trading?
The best method often blends price action, support and resistance levels, and indicators like moving averages and RSI, providing a balanced view that many traders depend on.
What does the 7% rule in stock trading mean?
The 7% rule in stock trading suggests limiting potential losses to around 7% on individual trades or portfolios, helping traders control risk and protect their capital.
How do you do technical analysis for trading?
You do technical analysis by examining chart patterns, drawing trendlines, and applying indicators to historical price data. This approach helps forecast movements and set clear trade entries and exits.
Does technical analysis actually work in trading?
Technical analysis works by using historical data, chart patterns, and market behavior insights to forecast trends. While no method is foolproof, it offers useful guidelines for making better trading decisions.