

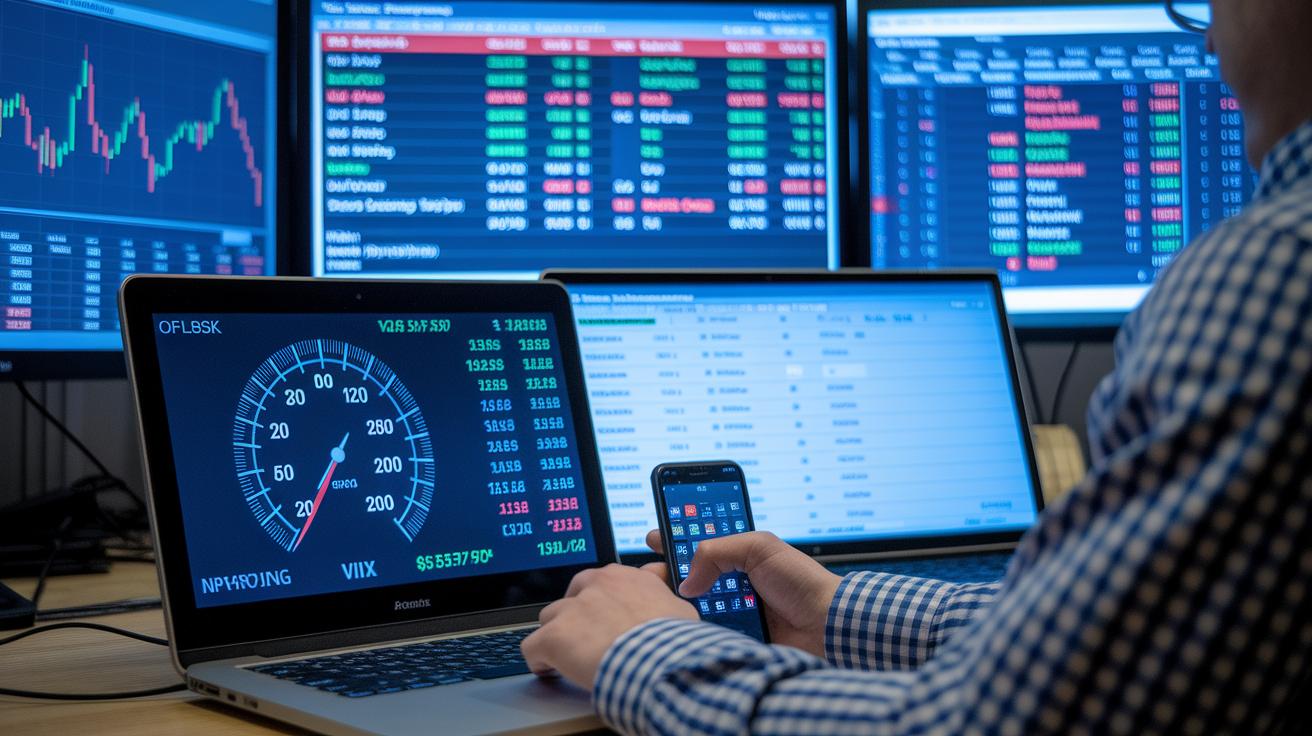
Have you ever noticed how fast the market can flip? The global markets volatility index puts all those swift changes into one simple number. It’s like checking the heartbeat of the trading floor, letting you see if investors feel relaxed or nervous. With clear data and on-the-spot math, this tool offers easy insights that help both pros and newcomers decide on their next move. In this post, we dive into how this key signal can guide trading decisions worldwide.
Understanding Volatility Gauges for Global Markets

Volatility is simply a way to measure how much a security’s price bounces around. In plain language, it shows just how wild price swings can get, much like a heartbeat that stays calm then suddenly races. When we mention global markets, we’re talking about the huge trading areas around the world where stocks are bought and sold. Here, a volatility gauge acts like a mood ring, giving us hints about how stressed or relaxed the market might be.
A global markets volatility index takes all those unpredictable price shifts and wraps them into one clear number. This number helps investors quickly see whether traders are feeling nervous or confident around the world. Using easy-to-understand math and live data, the index works a bit like a stress monitor for the stock market. Check it out, and you can immediately tell if the market is enjoying a calm day or if it’s readying for some stormy weather. This simple snapshot makes decisions easier for both seasoned investors and newcomers alike.
One of the best-known tools in this area is the VIX Volatility Index. Created by Cboe back in 1993, the VIX estimates how much the S&P 500 might move in the next 30 days by using the pricing of call and put options (these are contracts that let investors bet on future price moves). Basically, when the VIX goes up, it hints that investors might be getting jittery about upcoming changes, often before stock prices start dropping. On the flip side, a lower VIX signals that calm is returning. Many investors keep a close eye on the VIX, adjusting their portfolios as soon as they detect a shift in market mood.
global markets volatility index sparks clear market insights
The CBOE risk metric is like a barometer for market nerves. It’s been around since 1993 and uses near-term S&P 500 options to gauge how jittery investors might feel. Essentially, it blends data from both call and put options into one simple measure. It pulls in live market data to update in real time, giving you an instant snapshot of market sentiment. If you're curious about where it all began, take a look at cboe global markets.
It all starts by collecting quotes from S&P 500 options at various strike prices. Imagine checking the temperature in different parts of a city to get a full picture of the weather. Next, the process filters out the less useful data to keep things clean and relevant. After that, it calculates how widely those option prices differ, think of it like checking the range of notes in a song. They then annualize this difference over 30 days so that you can compare different market environments consistently. Finally, all this information is updated live, meaning the index reflects the market’s vibe at any moment.
This straightforward process makes the index an essential tool for modern risk models. By continuously updating with the latest trading data, it helps investors spot short-term market turbulence. At the same time, it fits neatly into bigger risk evaluation systems, acting as a reliable guide when you need to understand market stress quickly.
Historical Spikes in the Global Markets Volatility Index
Over the past few years, the global markets volatility index has been like a shock detector for the economy. From January 2019 until early 2020, the index stayed low, hovering around 20 or even less. Then, as worries spread around the world, especially when the COVID-19 crisis hit, the index shot up very quickly. This quick rise was a clear warning sign that investors were getting ready for rough times ahead.
| Date | VIX Level | Market Event |
|---|---|---|
| Jan 2019 – Early 2020 | ~20 or lower | Stable market conditions |
| March 16, 2020 | 82.69 | COVID-19 crisis (Dow -12.93%) |
This sharp change shows us how a high VIX isn’t just a number, it shows real fear among investors and a sign of market upheaval. When the index jumped to 82.69, it wasn’t just a number spike. It meant that traders felt scared and saw signs of big trouble ahead. Data like this helps investors understand shifts in mood and can prompt them to change their trading plans. In short, when the index leaps, it’s time for a closer look at your risk and perhaps a quick move to safeguard your investments.
Cross-Border Instability Indicators: Comparing Volatility Metrics

Around the world, different indices give us a look at market nerves. In Europe, the VSTOXX watches the Euro Stoxx 50, and in Japan, VKOSPI does the same for its main indices. You can think of it like checking weather reports from different towns to see if a storm is coming. Each one shows us the expected price swings over the next month in its region.
All these indices work in a similar way. They pull live data from regional options and then calculate how much prices might jump or drop, kind of like counting the beats of a catchy song. Both the VSTOXX and VKOSPI mix call and put quotes to predict day-to-day moves, just like the VIX does. In short, they turn everyday trading talk into numbers that tell us if a market might be calm or a bit jumpy.
These regional measures are more than just numbers. They act like barometers for market mood, giving us clues about shifts in different areas. When one index shows stress, it might mean nearby markets are also on edge, helping investors make smarter moves. This clear signal makes it easier to adjust portfolios when markets start to show signs of change.
Applying the Investor Sentiment Oscillation Index in Portfolios
Traders use different tools to take advantage of market ups and downs. One tool is VIX futures, which let you bet on future market swings directly, kind of like watching the pulse of tomorrow’s market action. Then there are VIX options. These let you cap your risk, so you know exactly how much you could lose if things get wild. And finally, there are ETFs that follow the index. They bundle this volatility exposure into one simple investment, making your portfolio feel like it’s got a ready-made toolkit.
Investors pick and choose these tools based on their needs. Some add them as a protective shield when market trouble seems near. Others use them to grab quick gains when the market makes sudden moves. And many mix them into a range of different investments to keep their overall portfolio balanced. Each approach helps you manage the uncertainty of the market while keeping your strategy flexible and responsive.
Stress Testing Protocols Using Global Markets Volatility Signals
Our risk teams use forward-looking VIX assumptions as a key ingredient when running stress tests designed to predict potential losses. They start by gathering real-time data from the global markets volatility index, watching for spikes that set the stage for different simulation scenarios. This approach mixes moments of market tension with periods of calm, turning those observations into concrete numbers that help model possible downturns. It’s like checking your tire pressure before a long trip, you get a reading that tells you if any adjustments are needed. By using these volatility signals, our models capture sudden price jumps or drops, mirroring the market’s natural mood swings and turning them into clear risk forecasts.
Dynamic simulation tools then use these inputs to build detailed stress-testing scenarios that cover both the expected and the unexpected. Our model designers adjust the shock sizes and time frames to mimic events ranging from sharp market corrections to long periods of turbulence. Each scenario is built with a broad economic view so that the tests pick up not only the immediate jitters shown by the volatility index but also its wider economic impact. These models help us predict how extreme shocks will hit different asset classes, paving the way for more robust strategies. This thoughtful method lets teams explore the interplay between market stress and investor reactions, giving everyone a clearer picture of risk exposure.
Key Steps in Stress Testing with Volatility Signals
- Selecting shock magnitudes
- Choosing time horizons
- Mapping shocks to asset classes
- Calibrating correlation assumptions
Final Words
in the action, we explored how volatility gauges work and why understanding calculation steps matters.
We looked at tools like the CBOE risk metric and saw real examples of market shifts, from routine days to sharp spikes.
We wrapped up by comparing global risk signals and sharing practical steps for portfolio stress testing.
These insights empower you to use the global markets volatility index as a guide through market changes.
Keep your focus sharp and your strategies clear as you make your next investment decisions.