


Have you ever wondered if one simple number can ease your market nerves? The global markets volatility index works like a plane’s dashboard, guiding you through sudden changes. It checks market stress and gives traders quick hints so they can adjust their plans, kind of like a pilot checking the weather before take-off.
Its rapid signals help you spot what might happen next, boosting your confidence even when surprises are on the horizon. Stick with us to see how this index turns uncertainty into smart, confident financial moves.
Defining the Global Markets Volatility Index and Its Market Significance
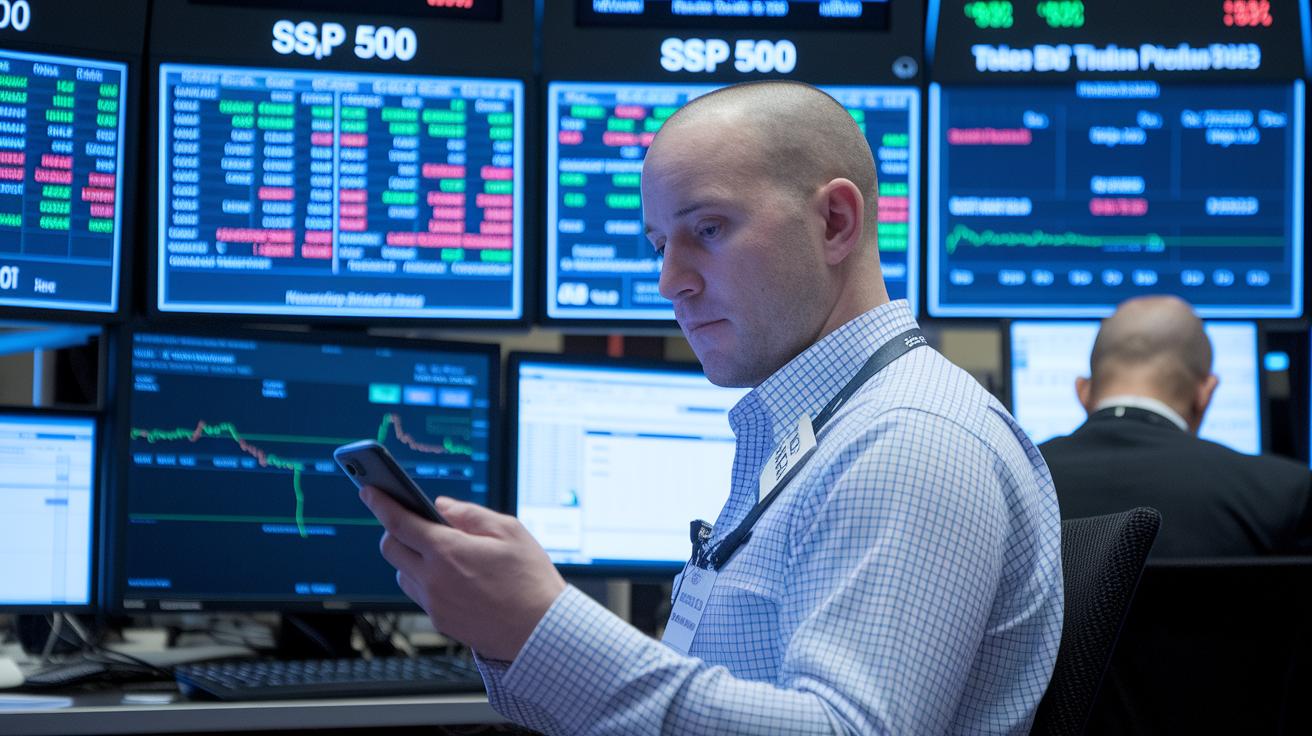
The VIX is a handy tool created by the Chicago Board Options Exchange. It tells us how much the S&P 500 options might change over the next 30 days. Folks often call it the "fear index" because it gives a quick peek into market worry. Imagine a trader checking the VIX like a pilot scans weather reports before takeoff, it helps set the mood for what might happen next.
When option prices go up, it usually means traders expect bigger market swings. Picture a calm lake that suddenly shows small ripples. Those ripples are early clues that the market might get choppy, giving investors a chance to adjust their game plan. This simple check lets everyone gauge risk and fine-tune their strategies.
What's more, the VIX is a smart gauge for spotting economic jitters both at home and abroad. When global events stir up tension, the VIX acts like a financial thermometer, quickly showing us just how volatile markets could become. This little index offers clear, real-time hints, making it easier for anyone to steer through uncertain times.
Calculation Methodology for the Global Markets Volatility Index
We begin by collecting live prices from both standard and weekly S&P 500 options. We only use contracts that expire between 23 and 37 days to ensure our focus is on a steady 30-day period. Essentially, this method figures out what the annualized implied volatility would be for a synthetic option with exactly 30 days left. By tracking simple price movement cues and using technical fluctuation analysis (which is just a fancy way of saying we watch how prices swing), we adjust weights among near-term maturities to keep a constant 30-day outlook.
Next, here’s how we put it all together:
- We gather live market prices from S&P 500 options expiring in 23 to 37 days.
- We compute the yearly expected volatility for a synthetic option set at 30 days.
- We gently blend the weights from these near-term options to maintain a continuous measure.
- Finally, we merge all these inputs using a systematic risk calibration, giving us our final volatility index value.
| Key Component | Description |
|---|---|
| Data Source | Live prices from both standard and weekly S&P 500 options |
| Expiry Range | Contracts expiring from 23 to 37 days, ensuring a 30-day focus |
This table gives a quick picture of our main elements, the live data and the expiry range. By following these clear steps, we create a reliable indicator that lets investors see market instability and gauge cross-market sentiment in real time. It’s like having a friendly guide to help you understand when the market mood is shifting.
Key Drivers Behind Fluctuations in the Global Markets Volatility Index
The index dances to the rhythm of traders reacting to both planned economic reports and sudden global happenings. Traders watch option prices jump or settle, using those moves to measure how risky the market feels. It’s like when unexpected news or political drama hits, you can almost see the mood shift instantly.
- Central banks changing rates can flip trader moods in an instant. When rates go up or down, traders quickly rethink borrowing costs and future growth, pushing volatility higher.
- Geopolitical tensions, such as rising conflicts or sudden diplomatic clashes, make the market feel edgy. When these events occur, option prices spike as fear takes the stage.
- Major economic data releases, like employment or inflation numbers, can set off quick bursts of volatility. If the numbers miss or beat expectations, traders jump right in.
- Corporate earnings reports sometimes stir things up. When a company surprises with strong or weak results, the options tied to those companies react and nudge the index.
- Unexpected shocks from shifting currency values or commodity prices add extra uncertainty. These changes impact global trade and pricing, feeding through to overall volatility.
- Trade disputes or sudden policy changes also move the needle. When talk of trade frictions or new regulations hits, market sentiment shifts, impacting the index as a whole.
Each of these drivers puts a unique spin on how markets behave. By keeping an eye on these factors, traders and investors can get a real-time snapshot of market confidence and risk. It’s the blend of planned events and unforeseen surprises that can either boost confidence or create ripples across global financial signals.
Historical Trends and Global Episodes of Market Volatility

Since 1993, the global markets volatility index has been like a quick snapshot of the market’s mood swings. Imagine it as a fast-moving photo capturing the moments when fear and uncertainty flood the corridors of trade. Big events, like the Asian crisis in 1998 or the financial shock in 2008, sent clear signals through the index. During those times, the index leaped sharply, much like hitting a sudden traffic jam that makes you slow down and think twice about your next move. Even troubles in emerging markets remind us that today’s financial systems are deeply connected, where changes in one corner can send ripples across the globe.
The EMV trackers add extra depth by offering monthly data on equity volatility all the way back to January 1985. These trackers work closely with the index, carefully following the ups and downs of the S&P 500 while also pinpointing specific influences like policy changes, market stress, or credit events. Think of this information as a multi-decade story book that not only tracks the timeline but highlights the key events behind each major move. This detailed insight helps both new investors and seasoned traders see patterns from the past and better understand today’s fast-changing market scene.
Comparing the Global Markets Volatility Index with Other Volatility Benchmarks
There are several ways to measure market jitters. Some benchmarks look at past price swings, this is known as realized volatility, which simply means checking out how prices moved before. Meanwhile, some specialized trackers, like EMV measures, break down market shifts in even finer detail. For example, one might compare data from volatility futures and ETF products to see different signals of market uncertainty.
On the other hand, the global markets volatility index is all about what’s coming next. It uses implied volatility, which predicts future price moves based on what traders expect. In other words, while others look back, this index gives you a peek into what might happen, using a set of near-term options. This approach offers a unique view compared to other measures that cover different time periods and liquidity levels.
In real life, each tool has its own strength. If you're after a quick read on how investors feel about risk right now, the global markets volatility index can be really useful. Meanwhile, if you want to see how prices behaved in the past, realized volatility measures are your go-to. Often, savvy portfolio managers mix both styles to get a balanced picture: using today’s signals along with a sense of historical trends to manage risk better.
Applying the Global Markets Volatility Index in Investment and Risk Management
Investors often turn to the global markets volatility index as a handy guide when handling risk and planning investments. This tool gives a clear look at what the market might do, helping you decide when to jump in or step back. It works like an early alarm for any change in market mood, making it a key player in keeping an eye on trends.
Many traders use the index for hedging, which is a way to protect against big losses. They often start with the index to choose products like futures, options, or volatility ETFs, these are tools that help spread out risk (diversification) or shield against extreme dips (tail-risk protection). For example, if the index shows signs of increased jitters in the market, traders might buy options to build a cushion against sudden drops.
Some investors even use the index for speculative trading, where they bet on shifts in market sentiment using products like contracts for difference (CFDs). This method can bring in big rewards, but it’s also risky. With high leverage (borrowing to trade), even small changes can lead to steep losses. That’s why this strategy is best for those who really understand the risks and have a strong risk management plan.
Another great benefit is that the index helps you keep track of your portfolio risk. It lets you check how your investments are spread out and make adjustments based on the latest market signals. By watching the index, you can fine-tune your asset mix when you see early signs of market stress.
In practice, the best move is to combine the insights from this index with other market clues to build a solid risk management system. Regularly reviewing and tweaking your strategy can help reduce losses and guide you through unpredictable market times.
Limitations and Criticisms of the Global Markets Volatility Index
You might think more data always means a better forecast, but relying on a small set of near-term data points can sometimes mislead you about overall market risk. The index looks at the implied volatility of just a few options. That means it doesn’t pick up on the bigger, real-life swings or long-term risks that happen in the market.
It mainly focuses on options that expire soon. So when market activity is low or options are close to expiring, its readings can get a bit skewed. While it captures the immediate jitters of the market, it doesn’t tell you if things are trending up or down. Rapid movements in either direction often look alike, which isn’t very helpful if you’re trying to make detailed trading choices.
On top of that, this narrow view misses broader economic shifts and doesn’t keep track of long-term trends. For anyone trying to get a feel for how the market might behave over time, this index falls short. There’s still plenty of room to improve how we gauge systematic risk in the market.
Future Directions: Enhancing Volatility Forecasting with Advanced Models
Forecasting models often miss the tiny details in how markets behave. Right now, many models built on implied volatility can’t catch those sudden, sharp shifts, kind of like a weather app that only shows the daily forecast but leaves out the chance of a sudden storm. This gap makes it clear: we need smarter methods that pick up the rapid pulse of data and signals from different markets.
New quantitative methods are really shaking up how we see market uncertainty. Researchers are exploring tools like GARCH models, Monte Carlo simulations, and even machine-learning to sharpen our predictions. It’s a bit like swapping an old compass for a modern GPS that gives real-time updates. With these high-frequency data feeds, we can catch quick changes in market trends and foresee fluctuations before they hit.
The next big idea might be creating a global volatility index. By blending data from many types of assets with policy-based EMV trackers, future models could test economic conditions under different shock scenarios. Imagine a system that works like a comprehensive financial health check, cutting through market noise and delivering clear, data-based insights for investors everywhere.
Final Words
in the action, we broke down how the global markets volatility index serves as a clear indicator of market moods, from its origins and calculation methods to its effect on risk management strategies. We touched on historical volatility, key market drivers, and comparisons with other measures. This guide gives you a solid grasp of how market sentiment transforms into actionable insights.
Keep exploring these insights as you build smart investment strategies and approach uncertainties with optimism.
FAQ
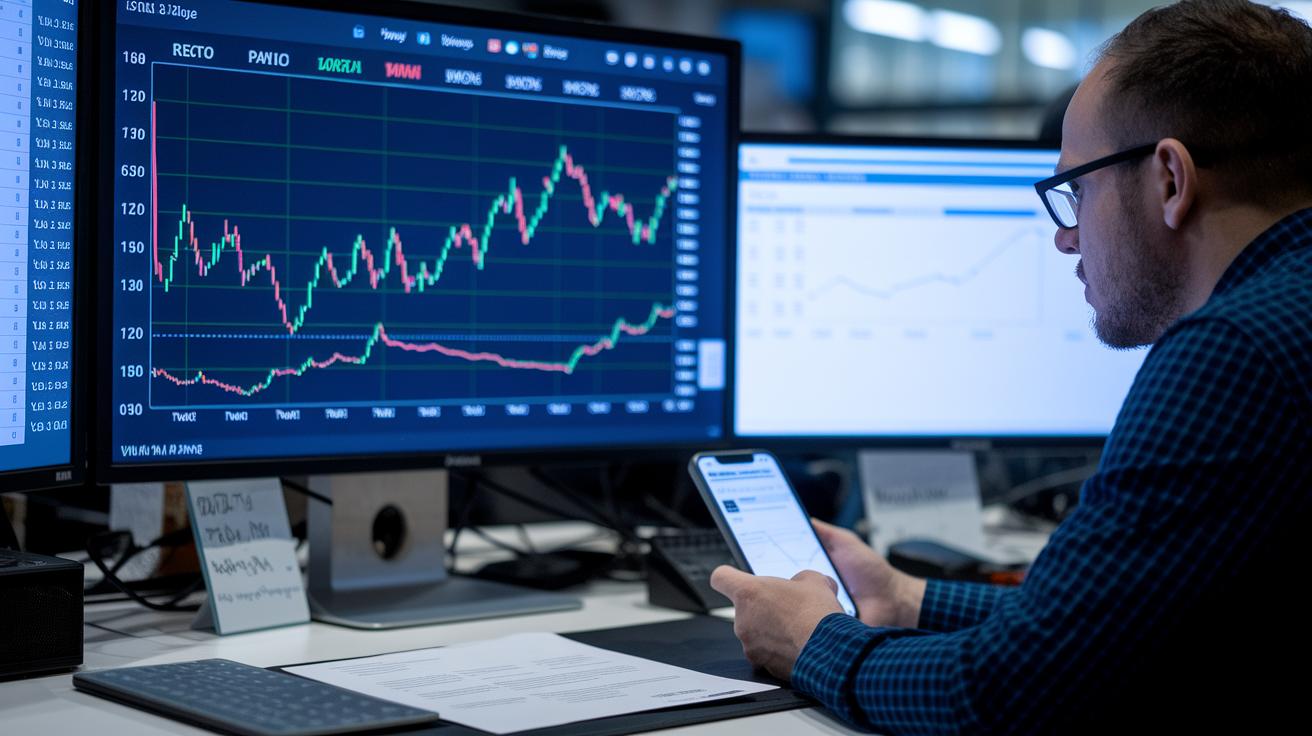
What do global markets volatility index charts or graphs show?
Global markets volatility charts display a real-time measure of implied market uncertainty by tracking S&P 500 options, helping investors gauge current risk levels.
Where can I view global markets volatility index historical data?
Historical data offers records of past volatility readings, allowing you to assess trend patterns and changes in market uncertainty over time for smarter planning.
When the VIX is high, is it time to buy?
High VIX readings indicate increased market anxiety and risk; this typically suggests caution rather than a straightforward buying opportunity.
What does the Fear and Greed Index indicate in relation to market volatility?
The Fear and Greed Index measures extreme market emotions, providing additional context to volatility readings by highlighting investor sentiment shifts.
What is meant by the Dow VIX?
The Dow VIX relates to a volatility measure focused on the S&P constituents, offering a perspective on market nervousness similar to the standard volatility index.
How can I access US VIX charts on TradingView?
TradingView provides interactive US VIX charts that let you explore real-time volatility and historical trends, making it easier to understand shifts in market sentiment.
What are VIX futures used for?
VIX futures allow traders to speculate on future market uncertainty, offering tools to hedge risk or take positions based on anticipated changes in volatility.
What is global market volatility?
Global market volatility reflects fluctuations across financial markets worldwide, signaling economic uncertainty and offering insights into international risk environments.
How does the VIX compare to the S&P 500?
The VIX offers a forward-looking view on market fear by estimating future volatility, while the S&P 500 tracks current price levels, providing a snapshot of market performance.
What is considered a good VIX score?
A good VIX score depends on market context; low readings generally signal calm markets, whereas higher scores suggest caution due to rising uncertainty.
What defines the S&P 500 volatility index?
The S&P 500 volatility index measures the expected volatility of S&P 500 options, serving as a reliable indicator of investor mood and market risk.
Which platforms offer reliable volatility index information?
Platforms like MarketWatch, TradingView, CNBC, Yahoo! Finance, Google Finance, and Seeking Alpha provide timely VIX data, delivering useful insights for informed investment decisions.