


Ever notice how trading can sometimes feel like a wild roller coaster and other times like a smooth, gentle ride? Volatility analysis uses simple tools, like candlestick charts (which show the opening, closing, and range of prices), ATR (a measure of how much prices change), and Bollinger Bands (that help track the upper and lower limits of a price range), to reveal when the market is buzzing or taking a break.
These tools give you a clear look at market behavior. It’s like getting a peek behind the curtain to spot smart buying or selling chances, even when things seem uncertain. Reading these signals turns confusing market swings into clear, actionable steps that can guide you toward smarter trades when it matters most.
Volatility Technical Analysis Fundamentals
Volatility technical analysis is all about understanding how quickly and widely prices move. It uses simple chart tools like candlestick open/close patterns, Average True Range (ATR), Bollinger Bands, and the Chopiness Index to show if price movements are wild or calm. There are also off-chart measures like the VIX, which helps traders peek into what might happen next by looking at how much the S&P 500 might move in the next 30 days.
Measuring volatility is key to getting how the market behaves because it shows both the speed and the extent of price changes. For example, when you see Bollinger Bands widen, it means prices are straying farther from the average. This gives a hint about market strength or weakness. And if the ATR goes up, it tells you that prices have been swinging more than usual, suggesting that traders might need to adjust their strategies.
Big moments like the U.S. Non-Farm Payrolls can suddenly spike volatility when real data doesn't match what was expected. These sudden moves can highlight risks but also point to opportunities. By using both on-chart measures and forward-looking off-chart signals, traders can make smarter, more informed decisions about where to position themselves.
In essence, volatility technical analysis blends tools and signals to offer a clearer picture of market excitement and calm, helping every trader feel a bit more confident navigating the ups and downs of the financial world.
Key Volatility Indicators in Technical Analysis
Traders use a handful of easy-to-understand tools to see how wild the market ride is. These indicators help show when prices are zooming around or taking a calm break, so you can make smarter choices.
Bollinger Bands act like a moving average with extra lines above and below, showing you when market swings are getting bigger. The Average True Range (ATR) tells you the average price range over time, higher numbers mean the market is more volatile.
The VIX, which looks at 30-day expected moves in the S&P 500, gives a quick peek at the overall market mood. Keltner Channels use ATR to create dynamic bands around price data, helping you spot shifts in trends.
Donchian Channels mark key points by tracking the highest and lowest prices over a set time, which can highlight potential breakouts. The Chaikin Indicator mixes price and trading volume to flag possible changes in market momentum, while the Twiggs Indicator does something similar to catch early trend shifts.
Lastly, the Relative Volatility Index (RVI) measures volatility on a scale from 0 to 100. In one case, a sudden spike in the RVI helped a trader avoid a major downturn by signaling an upcoming reversal.
Together, these eight indicators form a strong toolkit for keeping an eye on market fluctuations. By mixing these signals with your broader strategy, you can find the best times to enter or exit trades and manage your risk effectively.
Calculating Volatility Metrics in Technical Analysis
Traders figure out market swings by breaking price moves into parts they can measure. They usually start with the ATR, which means Average True Range. This tool checks three values: the difference between the day’s high and low, the change from the high compared to the previous close, and the difference from the low compared to yesterday’s close.
Next, they use Bollinger Bands. They take a simple moving average and then add and subtract two times the standard deviation (which is a way to see the normal spread of prices). This setup helps signal when market volatility is about to shift. It’s like getting a heads-up on whether prices are shaking things up or settling down.
Then there’s the VIX. This indicator mixes S&P 500 option prices in a weighted way to predict future market swings over the next 30 days. And don’t forget the Chopiness Index, it compares the ATR to the overall price range for a set period, letting traders know if the market trend is smooth or choppy.
These tools give traders clear insights into risk and help them adjust their strategies as market conditions change.
| Indicator | Calculation Method |
|---|---|
| ATR | Max(current high-low, |current high – previous close|, |current low – previous close|) |
| Bollinger Bands | SMA ± 2× standard deviation |
| VIX | Weighted blend of S&P 500 option prices for 30-day implied volatility |
| Chopiness Index | ATR compared to price range over a specific period |
Detecting Volatility Spikes and Fluctuation Patterns in Technical Analysis

Traders often notice volatility spikes when they see the Average True Range (ATR) jump, Bollinger Bands widen, and the Chopiness Index drop. This combo usually means the market's about to change direction quickly, often because of unexpected news like the Non-Farm Payrolls report. It’s like watching a calm lake suddenly ripple when a stone is thrown in, giving you a clear signal to either jump in or back off fast.
Another clue comes from the candlestick charts. When you see huge gaps between the opening and closing prices, it suggests that volatility could be ramping up or winding down. These big swings in candle values are hints that a choppy market move is either just starting or about to wrap up, helping you decide the best moment to enter or exit your trade.
By mixing insights from ATR, Bollinger Bands, the Chopiness Index, and those standout candlestick patterns, traders get a full picture of both sudden and recurring market swings. This clear view helps you understand how market moods shift quickly, making it easier to adapt your strategy on the fly when uncertainty hits.
Integrating Volatility Technical Analysis into Risk Management
Traders keep a close eye on market swings to adjust the risk they take. They use signals like these to fine-tune tools such as stop-loss orders and the sizes of their positions. When the ATR (Average True Range, which shows how much the price is moving) is high, setting your stop-loss at a multiple of this number can help match your risk to the current mood of the market. This way, traders also adjust how big their bets are, so that any losses don’t get out of hand. History shows that sticking to clear risk rules can really pay off, many retail CFD accounts hit problems like margin calls when unexpected swings happen.
Using these metrics is like having a map during a busy market day. They help not only in protecting your portfolio but also in deciding when to jump in or out of a trade. Some traders even hedge with instruments like VIX futures or options (which are tools to manage risk during big moves) to smooth out those rough periods.
Here are some practical tips for managing risk with volatility:
- Set stop-loss orders at multiples of the ATR to fit the current market movement.
- Adjust your position sizes based on recent volatility readings to avoid large losses.
- Hedge your positions with VIX futures or options to cushion against sudden market changes.
- Keep an eye on volatility indicators to catch shifts in the market’s mood.
- Use data-driven risk management tools, like those available at risk management websites, to fine-tune your strategy.
- Regularly review and update your risk limits to keep up with changing market conditions.
This approach is all about taking small, smart steps to manage your risks while still being ready to seize opportunities as they come.
volatility technical analysis drives smart trades
Traders are now using simpler ways to guess which way the market will move. They use tools like switching systems, auto-correlation (checking how today's price relates to yesterday's), and methods that deal with tricky, non-linear data. With these fresh ideas, traders can spot when prices are likely to change. So, they turn cold data into smart, clear-cut trading moves.
Other tools include models that follow random price swings and algorithms that spot hidden patterns. These help traders see changes well before regular charts show them. New chart markers cut through the market noise, while smart moving averages focus on true trends. Altogether, these methods help traders decide on good moments to buy or sell, making smart use of the market's signals.
Volatility Technical Analysis Case Studies
Real-world examples let us see how volatility tools work in action. Each case study links clear indicator readings to specific trading events, helping you understand historical swings and intraday shifts. When key turning points are marked with clear signals, it’s easier to follow how these methods guide trading strategies and manage risk. These hands-on reviews of market moves and volatility models offer great insights for learning about risk over time.
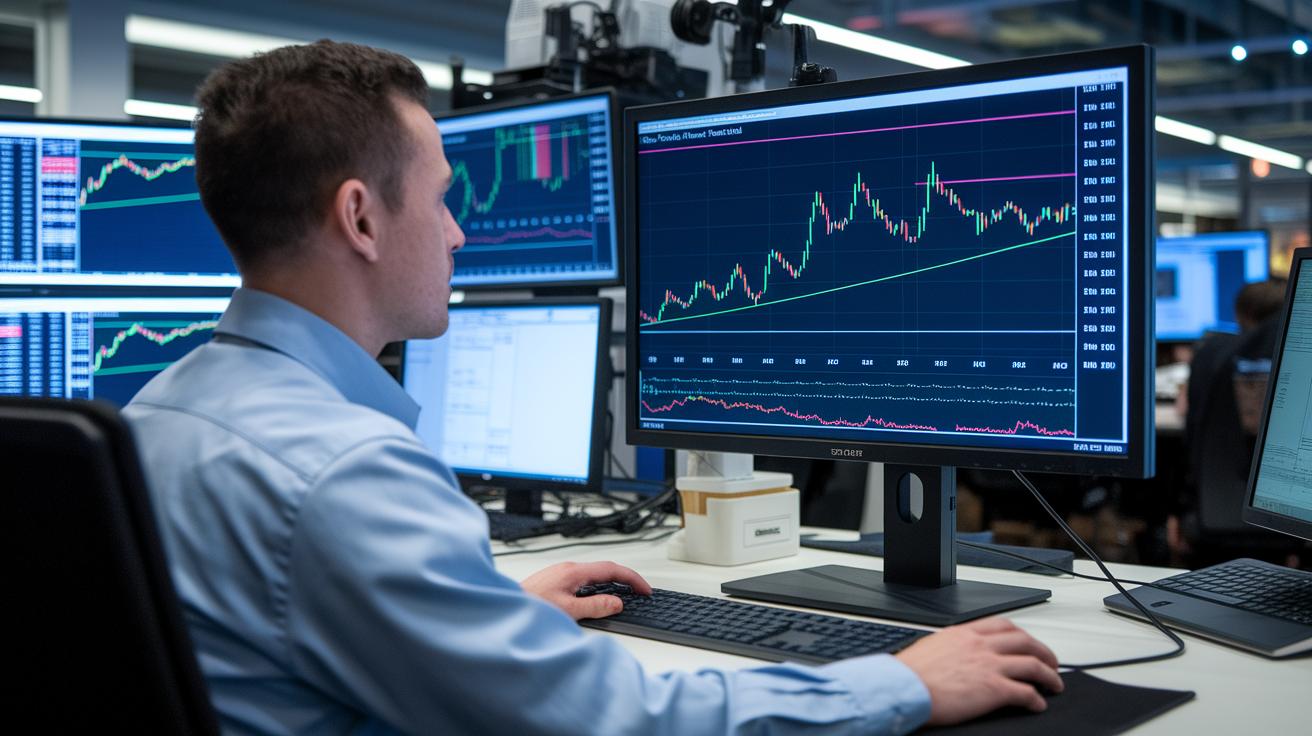
S&P 500 4-Hour Chart Example
On August 27, 2025, a 4-hour S&P 500 chart painted a dramatic picture of the market. Bollinger Bands spread out suddenly, pointing to a big shift in prices from the average. At the same time, the ATR, showing how much prices usually move, spiked, hinting that movements were more extreme than usual. The Chopiness Index confirmed the market was in a clear trend rather than being choppy. This snapshot helped traders easily spot potential entry and exit points during a busy market phase.
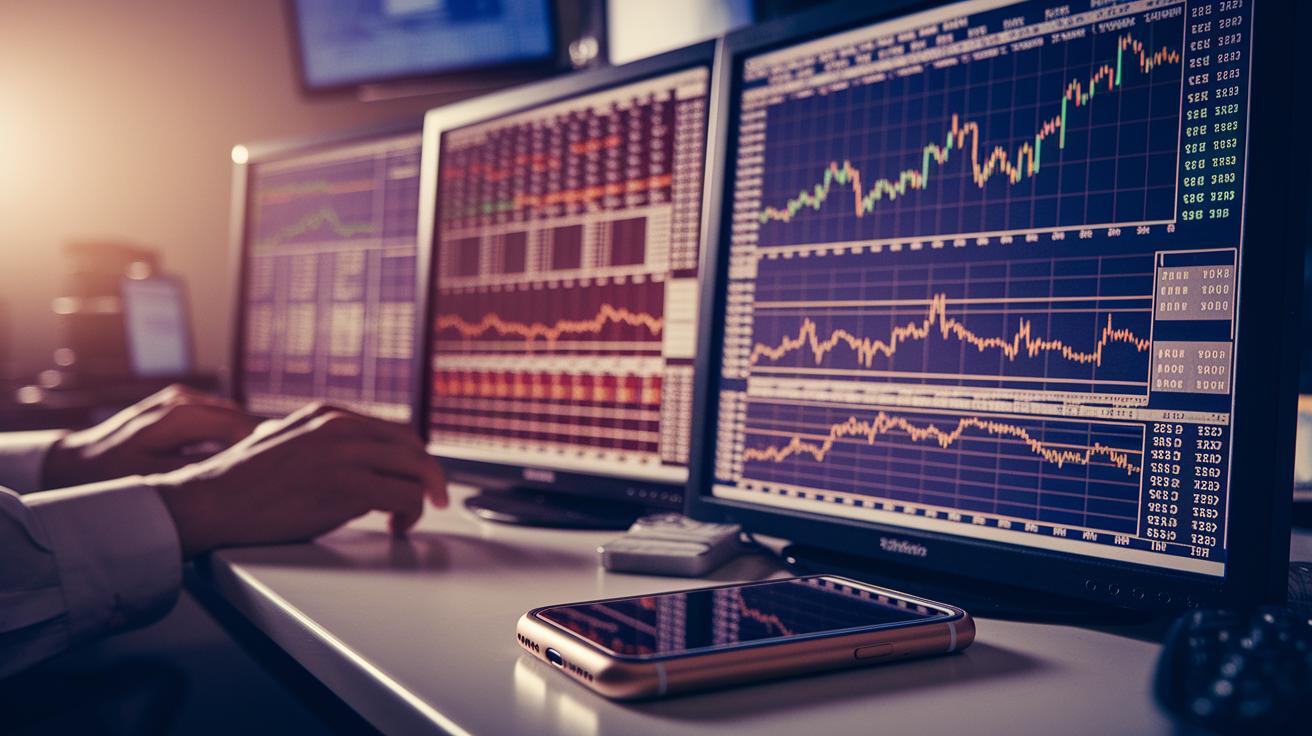
VIX Surge During NFP Release
During the U.S. Non-Farm Payroll release, the VIX, a measure estimating 30-day market volatility, jumped noticeably. This surge in implied volatility reflected rising concerns among investors about sudden price swings from unexpected labor data. The quick rise of the VIX acted like an early warning, nudging traders to be more cautious and adjust their risk management. It was a solid reminder that sometimes, the market sends clear signals when big economic news hits.
Final Words
in the action, we explored the essentials of volatility technical analysis by breaking down key tools like ATR and Bollinger Bands alongside real-life market examples. We reviewed how chart patterns and risk signals can guide trade decisions in dynamic markets. This recap blends practical tools with hands-on examples to show how simple metrics help gauge market swings. Keep testing your strategies, embrace each twist with optimism, and let clear data guide your next smart move.
FAQ
What does a volatility technical analysis PDF include?
A volatility technical analysis PDF includes key concepts and definitions, outlining tools like ATR and Bollinger Bands to help traders understand market swings and plan their risk management.
What insights does a volatility technical analysis chart offer?
A volatility technical analysis chart shows price fluctuation details and indicator readings, allowing you to visualize trends, detect volatility spikes, and adjust your strategies accordingly.
What can you expect from a volatility technical analysis PowerPoint presentation?
A volatility technical analysis PowerPoint presentation presents charts, formulas, and case studies in a visual format, making it easier to interpret market fluctuations and understand effective risk measures.
How does a volatility technical analysis calculator work?
A volatility calculator uses formulas—often based on ATR or standard deviation—to quickly measure price movement, helping you assess market risk and determine effective entry and exit points.
What is the volatility technical analysis formula?
The volatility technical analysis formula typically uses measurements like ATR or standard deviation to calculate the extent of price movements, guiding traders in their risk evaluation and decision making.
Which volatility indicator is best on TradingView?
Many traders find ATR or Bollinger Bands on TradingView very effective as they clearly reflect price swings and volatility, enabling swift adjustments in trading positions for better risk management.
What does volatility mean in technical analysis?
Volatility in technical analysis means the speed and distance of price swings. It helps you gauge the level of market risk and adjust your trading strategies based on how fast prices move.
Is 70% implied volatility considered high?
A 70% implied volatility indicates significant market uncertainty, suggesting high option premiums. This level is generally seen as a sign that market conditions are dynamically shifting.
Is 20% volatility considered high?
A 20% volatility level points to moderate market movement. Depending on the asset and market conditions, it can signal relative stability or offer an opportunity to adjust your strategy.
What is the best technical indicator for volatility?
The best indicator depends on your trading style, though many lean toward ATR or Bollinger Bands because they effectively capture market fluctuations and help guide sound risk management decisions.