

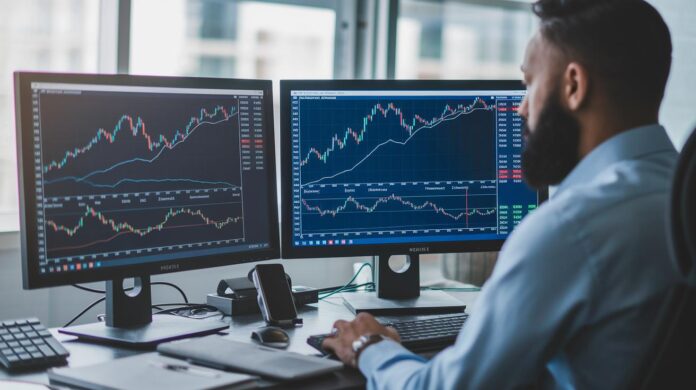
Ever wonder how some traders catch market shifts before the rest of us? Technical analysis tools let you see changes in the market as they happen. They work like a clear window into real-time data.
Take TradingView, TrendSpider, or StockCharts. These tools turn basic charts into smart signals that help guide your trading moves. Their easy-to-read visuals make it simple to decide quickly during fast market changes.
In short, these programs light up market trends and give you a trusted edge in trading today.
Top Technical Analysis Programs for Predicting Market Trends
Dive into this collection of technical analysis tools that bring together the best platforms for real-time charting, clear indicators, and solid analysis.
- TradingView: TradingView is a favorite for real-time data, offering more than 100 built-in indicators and community-created scripts that help traders quickly spot market shifts.
- TrendSpider: TrendSpider uses smart AI to design intuitive charts, live scanners, backtesting, dynamic alerts, and even trading bots. It’s a smart option if you’re looking to automate your strategies.
- Koyfin: Covering over 100,000 assets, Koyfin gives you customizable charts that show growth rates, margins, and drawdown trends, ideal if you need deeper market insights.
- StockCharts: StockCharts brings powerful modules like SharpCharts and StockChartsACP, which support over 80 technical indicators so you can analyze market signals accurately.
- Finviz Elite: Finviz Elite goes beyond basic analysis with strong backtesting tools, detailed screeners, and interactive heatmaps that refine both technical and fundamental reviews.
- TIKR: TIKR focuses on the global stage, covering 92 countries and 136 exchanges at a budget-friendly price, making it a reliable mix of technical data for investors everywhere.
Charting & Indicator Features of Leading Technical Analysis Programs

TradingView is like having your own digital sketchpad. With over 100 different indicators and drawing tools, you can create custom charts that react as fast as the market does. It feels like watching a chameleon change colors when the market shifts, simple and effective.
StockCharts steps in with its SharpCharts and StockChartsACP tools. These give you custom alerts that turn plain data into clear, actionable signals. It’s a handy way to catch changes before they become big news.
Koyfin makes numbers accessible by turning them into visual art. By using tools like cumulative performance and drawdown curves, it helps you read complex data as if you’re looking at a friendly picture.
TrendSpider offers a chance to design your own charts. Its custom overlay functions and indicator options help you build personalized views that make trends stand out clearly.
Finviz Elite rounds off the group with advanced heatmaps and real-time filter alerts. These features give you a quick snapshot of market activity, making it easier to see what’s moving.
| Program Name | Number of Indicators | Unique Chart Feature |
|---|---|---|
| TradingView | 100+ | Extensive drawing tools and indicator library |
| StockCharts | 80+ | Custom alerts with SharpCharts and ACP modules |
| Koyfin | Varies | Cumulative performance and drawdown curves |
| TrendSpider | Customizable | Bespoke overlay functions and indicator design |
| Finviz Elite | Comprehensive | Advanced heatmaps with real-time filtering |
Each platform changes plain market data into clear, vivid visuals that help you spot trends early. They’re like a trusted friend in a fast-moving market, making difficult numbers feel accessible and straightforward.
Backtesting & Simulation Capabilities in Technical Analysis Programs
When you're trading, it really helps to check your game plan by looking at past data. Backtesting tools let you run your trading ideas on old market data, almost like rehearsing a play before the big performance. It’s cool to see how a strategy might have worked in the past, and several programs make this process both simple and insightful.
These platforms take the mystery out of crafting a strategy. They turn raw numbers into clear reports and simulated results, so you know what to expect. For example, TrendSpider’s tool tests strategies using past open-high-low-close (OHLC) data, while TradingView’s Pine Script lets you set up automatic trials that run like clockwork. StockCharts ACP gives you detailed performance reports, and Finviz Elite helps you use custom screeners to see what worked before.
Key backtesting features include:
- TrendSpider’s tool tests strategies on past OHLC data, so you can see the trends that moved the market.
- TradingView’s Pine Script offers automated strategy trials, turning old charts into a practice stage.
- StockCharts ACP gives performance metrics that paint a clear picture of past trades.
- Finviz Elite lets you backtest custom screeners, and Koyfin shows drawdown scenarios to help you check risk.
AI & Algorithmic Signal Detection Tools in Technical Analysis Programs
TrendSpider
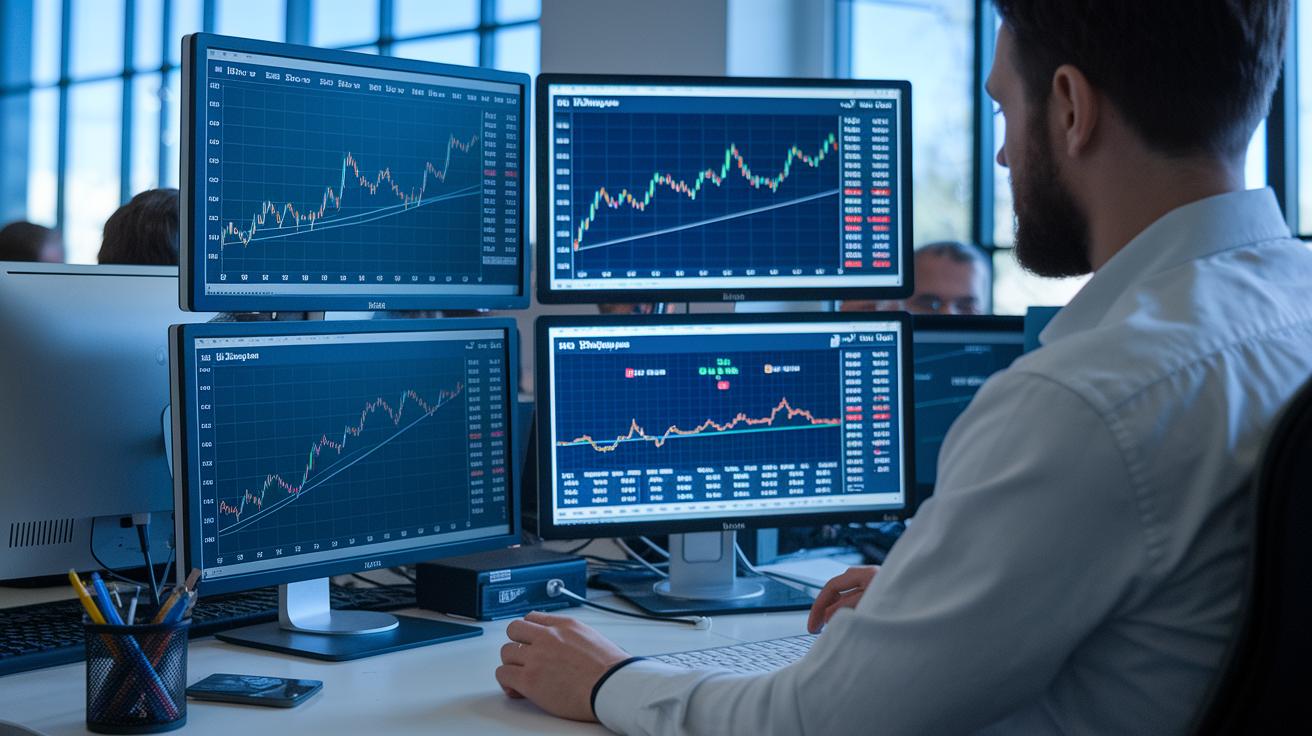
TrendSpider lets you sit back and relax while its AI Strategy Lab finds trendlines automatically. It reviews your charts and picks up on key trends fast, kind of like having a smart assistant that reads the market for you.
Trade Ideas
Trade Ideas brings in “Holly” AI with over 60 ready-made algorithms. Holly scans through heaps of market data so that you can catch trading opportunities without breaking a sweat. It’s like having an extra pair of eyes to spot the latest market moves.
Danelfin
Danelfin helps you notice classic chart patterns, whether you’re on its Free plan or one of the paid tiers ($25/mo for Plus and $70/mo for Pro). It checks for well-known signals so you won’t miss those tricky market cues that might slip by during manual analysis.
Tickeron
Tickeron offers AI trading robots that work for everyone, starting with free options up to its Expert level at $250/mo. The system combines live data with smart algorithms to suggest trade signals, making it feel like the market is sharing its secrets with you.
WallStreetZen
WallStreetZen uses a robust AI model built on over 20 years of market data, analyzing 115 different factors. It dives deep into market history and trends to highlight trading signals, giving you insights that many investors find both impressive and solid.
Fiscal.ai
Fiscal.ai provides research powered by AI with different plans, including Free, Plus ($24/mo), and Pro ($64/mo with a 20% annual discount). It mixes smart algorithms with current data to uncover patterns, helping to bring clarity and confidence to your trading decisions.
Free vs Paid Technical Analysis Programs
Many technical analysis programs come in free and paid versions, each built to meet different needs. Free tools are a great way to dip your toes in, they give you the basics and let you start exploring market trends without any cost. For instance, TradingView’s free version offers three indicators per chart and simple alerts, perfect when you’re just testing the waters.
Finviz’s free option gives you a delayed screener and heatmaps, giving you a quick look at the market, even though you don’t get real-time data. Platforms like Danelfin and Tickeron also have free setups that offer essential charting, which makes them very user-friendly for beginners.
On the flip side, some platforms, such as Koyfin and TrendSpider, require a subscription for full access. They usually offer trial periods so you can check out all the advanced tools and customization options before committing. Fiscal.ai even lets you try backtesting with its free version, but you’ll need to upgrade if you want unlimited testing power.
Pros and cons of each tier:
| Free Versions | Paid Subscriptions |
|---|---|
| Cost-free, super accessible, and great for learning the basics | Offers in-depth tools, more customization, and real-time features |
| Limited indicators, alerts, and no access to real-time data | Comes with a subscription fee |
In short, your choice depends on what you need. If you’re beginning your journey, the free versions give you a solid start. But if you crave more detailed insights and faster updates, investing in a paid option might be the better move.
Platform Compatibility & Integration for Technical Analysis Programs

TradingView works on a bunch of devices. You can use it on your web browser or through native apps on Windows, macOS, iOS, and Android. This means you can check market trends whether you're sitting at your desktop or grabbing a quick update on your phone.
TrendSpider is a browser-only tool with a responsive design that fits nicely on any screen size. Even on a smaller device, you'll enjoy a smooth experience.
Koyfin runs entirely on the web, which keeps it lightweight yet powerful enough with its charting tools. StockCharts goes further by offering both web and mobile-friendly access, allowing you to stay on top of the market no matter where you are.
Finviz is also available on both web and mobile browsers, helping you stay connected to real-time market insights throughout your day.
TIKR and Finchat are designed to work through web portals. They offer a seamless, cloud-based solution with great data feeds and speedy connectivity. This ensures your technical analysis is always agile and at your fingertips.
Pricing & Plan Comparison of Technical Analysis Programs
Take a look at this table where we break down the pricing details for seven popular programs. It tells you if a program has a free option and shows the entry-level and premium prices side by side.
| Program | Free Tier | Entry Price | Premium Price |
|---|---|---|---|
| Danelfin | Yes | $25/mo (Plus) | $70/mo (Pro) |
| Tickeron | Yes | $60/yr (Beginner) | $250/mo (Expert) |
| Fiscal.ai | Yes | $24/mo (Plus) | $64/mo (Pro) |
| TrendSpider | No | $39/mo | $129+/mo |
| Finviz Elite | No | $39.50/mo | $39.50/mo |
| TradingView | Yes | $14.95/mo (Pro) | $59.95/mo (Premium) |
| Koyfin | No | $24/mo | $24/mo |
Every program has its own way of charging, so you can pick one that suits you best. Some platforms, like Danelfin, Fiscal.ai, and TradingView, let you try them out for free before you commit. Tickeron gives you choices with both yearly and monthly plans for different levels, which can be really handy if you like options. On the other hand, TrendSpider and Finviz Elite keep it simple with just one price, and Koyfin sticks to one affordable monthly rate.
This side-by-side view makes it super easy for you to compare entry-level access to more robust, premium features. Whether you’re just starting out or looking for advanced tools, you can quickly spot which plan fits your budget and trading needs.
How to Select the Right Technical Analysis Program for Your Trading Style
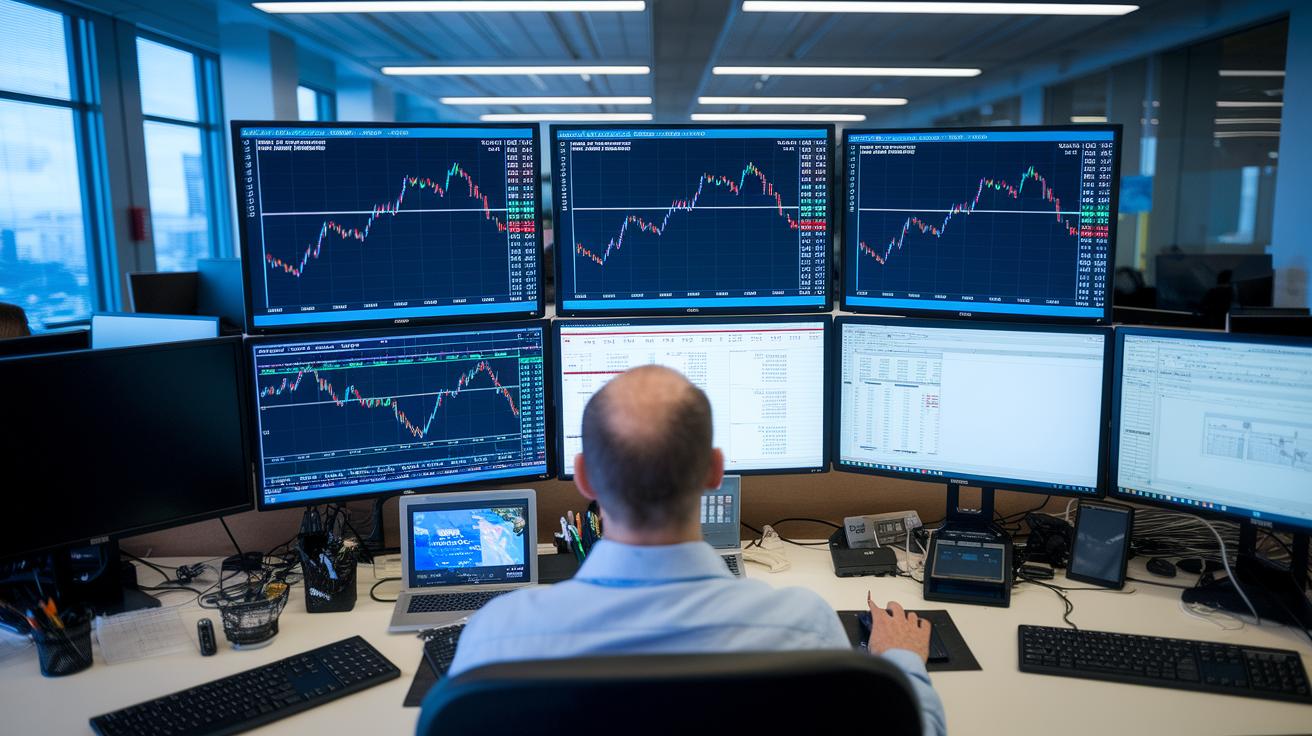
When you’re picking a technical analysis program, think of it like choosing the perfect tool for your own trading style. You want a platform that fits your techniques like a glove, with safety checks and flexible analysis features built right in.
-
Built-in risk management tools: Look for features that let you adjust your stops and get real-time alerts. This way, if prices shift unexpectedly, you’re the first to know. It’s like having a built-in safety net for your investments.
-
Indicator support: Make sure the software offers basic indicators such as moving averages and the RSI (that’s the Relative Strength Index, which helps you see how fast prices are moving). These tools act like signposts, pointing out when the market might be about to change direction.
-
Depth of backtesting: A strong backtesting system lets you test your trading ideas on past market data. It’s like having a practice run before diving into real trades, so you know your strategy can handle different market conditions.
-
Custom chart layouts for support and resistance: The program should allow you to customize your charts. Being able to highlight key price levels is super helpful, since it means you can quickly spot important trends.
-
Multi-timeframe trend and volume studies: Check that your program lets you study trends over different time periods and provides detailed analysis of trading volume. This helps you see both the short-term action and long-term trends clearly.
Final Words
In the action, we reviewed top chart tools, real-time indicators, backtesting features, AI signals, pricing options, and device support. This article broke down how each tool fits different trading styles, plus a checklist to match your needs.
By comparing free and premium plans, you now have a clear picture of technical analysis programs that can boost confidence in volatile markets. Let these insights fuel a positive push toward smarter, more informed trades.
FAQ
What free technical analysis programs are available online?
The free technical analysis programs available online offer real-time data, charting tools, and sometimes buy/sell signals, helping you analyze market trends without a heavy upfront cost.
What are some top stock and technical analysis software options?
The best stock analysis software and technical analysis programs include platforms like TradingView, TrendSpider, and Koyfin, which provide real-time data, advanced indicators, and customizable charts.
Do any free versions offer buy and sell signals?
The free versions of some platforms integrate buy and sell signals with essential charting tools, giving you a glimpse into market action before opting for premium features.
Where can I find technical analysis tools in PDF format?
The technical analysis tools in PDF format are found in downloadable guides on various financial websites, providing step-by-step instructions and overviews of charting and indicator techniques.
Which technical analysis course is recommended?
The recommended technical analysis course focuses on practical risk management and indicator strategies; compare course content and user reviews to find one that fits your trading style.
What is the 3 5 7 rule in trading?
The 3 5 7 rule in trading refers to a guideline using a set number of criteria—such as three key indicators, five support/resistance levels, and seven data points—to shape your analysis approach.
Can ChatGPT analyze stocks?
ChatGPT can analyze stock trends and offer basic insights by discussing market data and technical analysis concepts, but it should not replace personalized investment advice or live data platforms.
What is the 7% rule in stock trading?
The 7% rule in stock trading suggests setting a target or stop-loss at a 7% change from your entry point, aiming to manage risk and reward in your trading approach.
What is AI technical analysis software?
AI technical analysis software employs algorithms and historical data to scan market trends, automatically detect patterns, and generate trading signals to assist in decision-making.
What features does institutional trading software provide?
Institutional trading software offers powerful tools such as real-time analytics, extensive asset coverage, backtesting, and simulation capabilities to support more advanced trading strategies.
What are the best free technical analysis websites and trading tools for beginners?
The best free technical analysis websites and beginner trading tools provide user-friendly interfaces, multiple indicators, basic charting features, and educational resources to help new traders build confidence.
What tools are available for trading stocks?
The tools available for trading stocks include charting platforms, technical indicators, backtesting and simulation programs, and real-time scanners, all designed to help you analyze market trends effectively.