


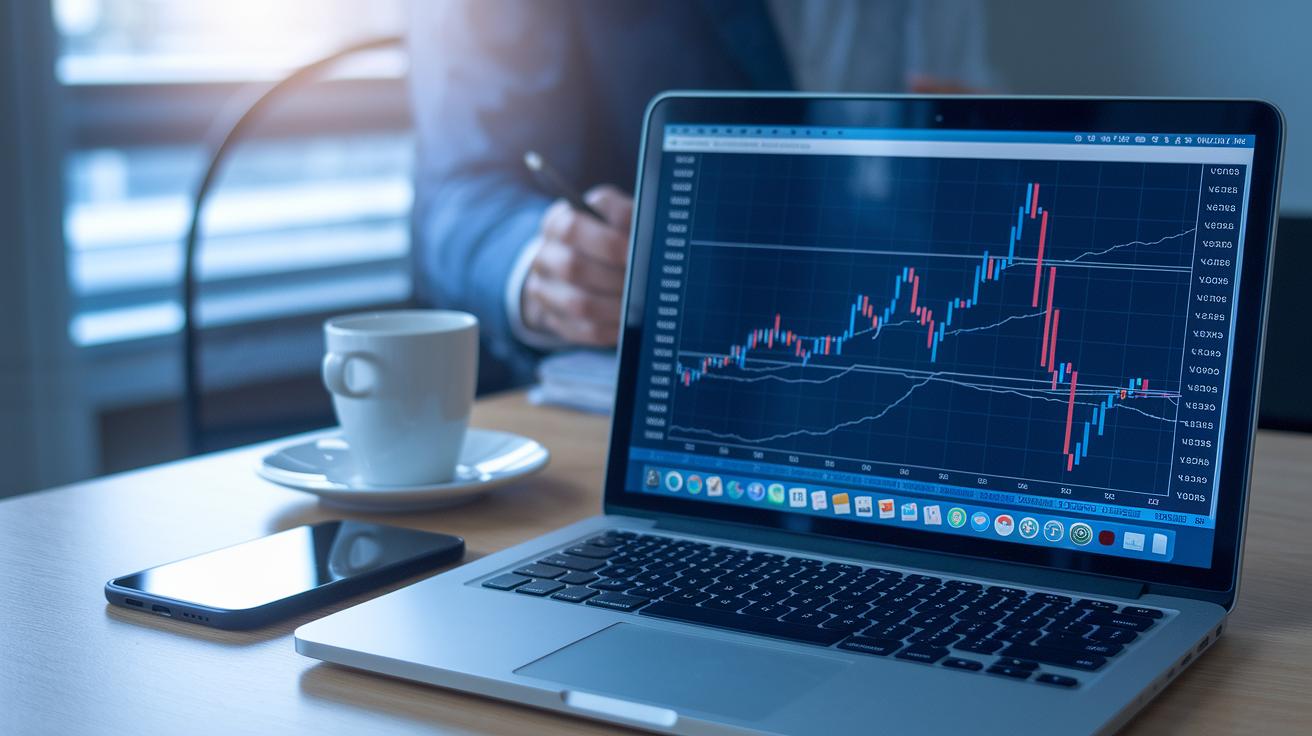
Ever notice how market charts might seem to hide a little secret? When you spot familiar shapes in the way prices move, it's like finding a hidden message that hints at what could come next. Traders see these patterns as clues from past trends, making it easier to decide when to buy or sell. Reading these signals can help you trade smarter and feel more certain about your choices.
How Pattern Recognition in Technical Analysis Enhances Trading Decisions
Pattern recognition in technical analysis really works because it puts the price right where it matters most. Analysts believe that every key detail is already reflected in the current price, so they focus on past price movements instead of getting bogged down by things like economic reports or company earnings.
When you use data-driven forecasting, you're turning old price trends into ideas for future moves. Picture a chart that repeatedly shows shapes like a head and shoulders or a double bottom. These visual clues can suggest the best times to jump in or step out of a trade, almost like watching a neat row of dominoes fall one after the other. It builds trust in your decisions, especially when trader moods swing around in the market.
But sometimes reading these patterns isn't clear-cut. One trader might see strong momentum in a pattern, while another might see just a brief pause in the market. Positive vibes can push prices up, but a bit of fear or uncertainty can pull them down. In short, technical analysis mixes a bit of personal judgment with hard data.
By combining a memory of past prices with automated tools, traders turn what they see on a chart into clear, actionable signals. These data-driven techniques sharpen an age-old strategy, helping both new investors and seasoned pros feel more confident about what's coming next.
Chart Patterns and Price Structure Examination for Signal Mapping
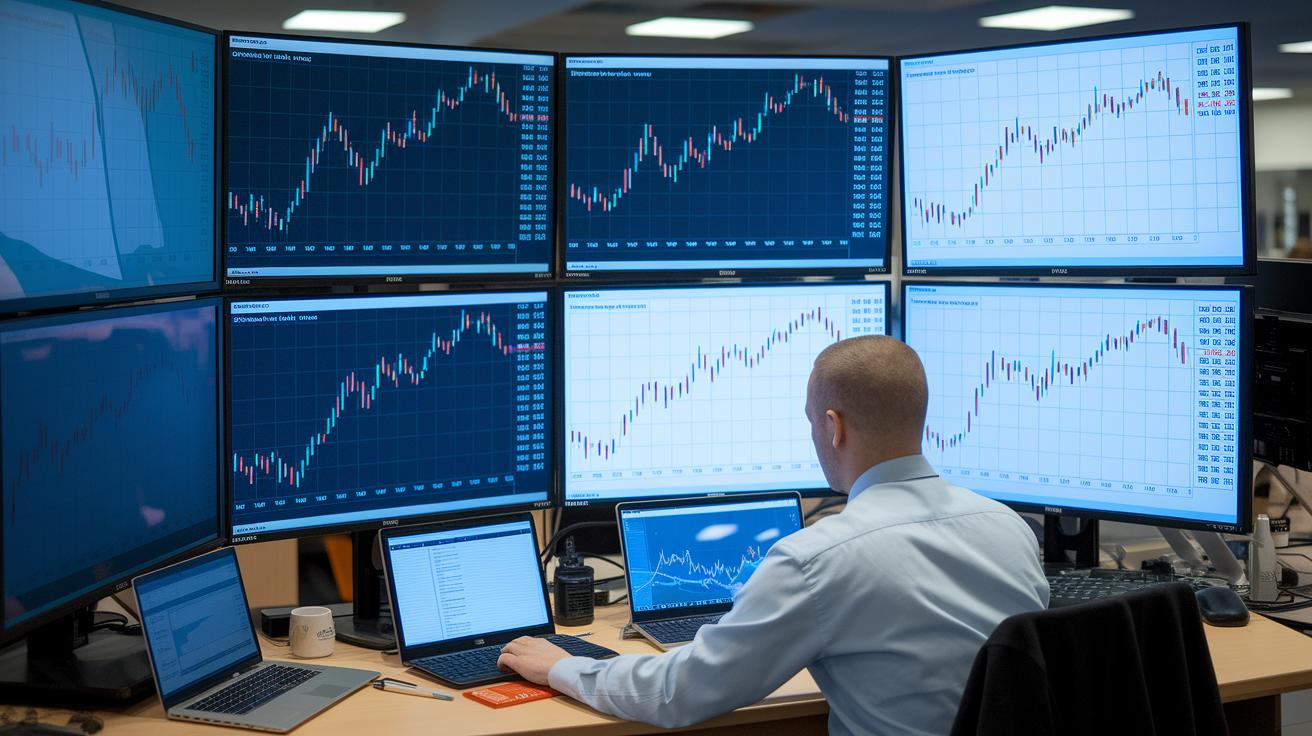
Traders use chart patterns and a close look at the price structure to decide when to enter or exit a trade. They sort charts into two groups: continuation patterns, which suggest the current trend will keep going, and reversal patterns, which hint at a change in trend. For example, a head and shoulders pattern might signal a reversal, while a double bottom tells us that the price could bounce upward from a strong support level.
Looking at price structure means watching key support and resistance levels. Think of these levels as invisible walls where price moves might slow or even turn around. Traders focus on moments when the price breaks through these walls, as that can confirm a signal. Some prefer to review patterns like flags, pennants, and triangle formations with a careful eye, while others use automated tools like Autochartist and TradingView to quickly link chart patterns to real market moves.
By blending classic methods with cutting-edge tools, traders can spot strong trading opportunities. When you mix pattern recognition with careful attention to support and resistance levels, you get a clear map of where prices could go. This smart mix of art and science not only helps in making better decisions but also lights the way to managing risk and timing your trades confidently.
Statistical Signal Detection and Algorithmic Pattern Recognition
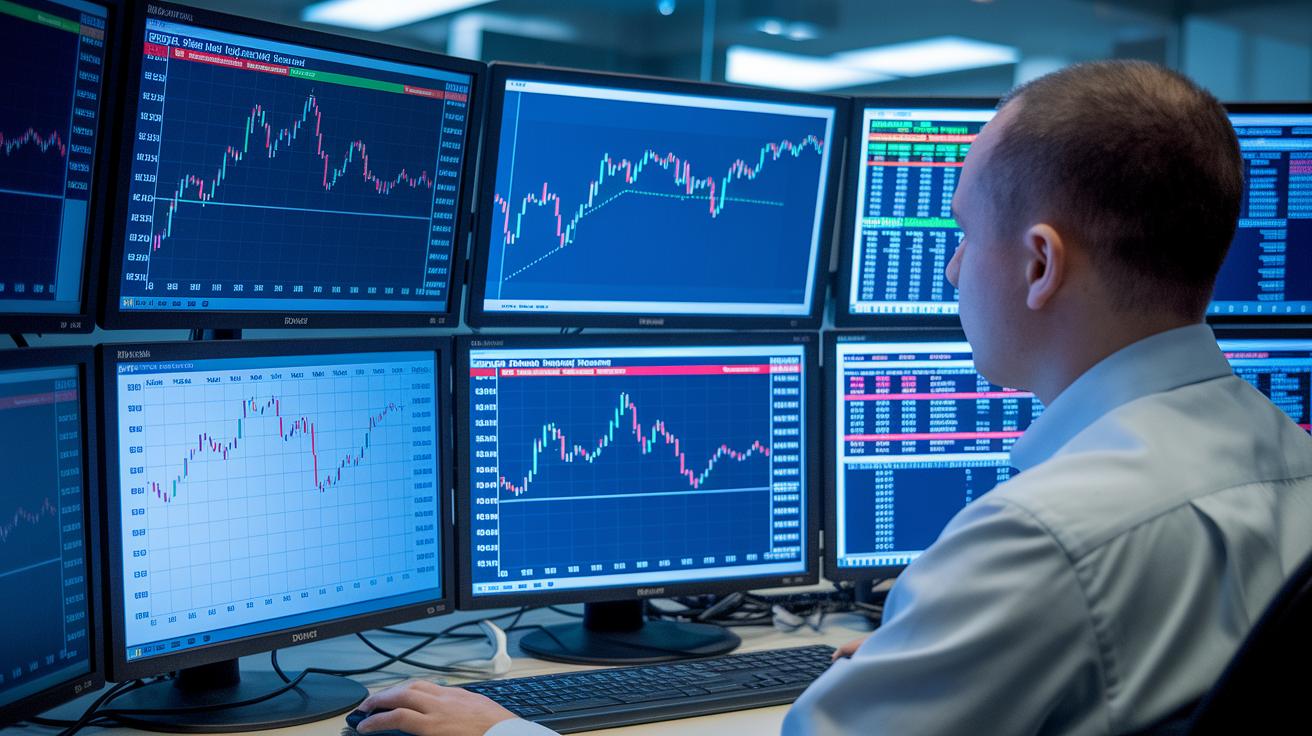
New machine learning techniques have completely changed the way traders catch common market patterns. Automated tools sift through enormous piles of past price data and turn raw numbers into clear trading ideas. And with platforms like MetaTrader 4 and 5, these systems scan global markets almost in real time, giving traders quick insights to seize the best opportunities as soon as they appear.
Algorithmic signal processing uses math-based trading models and market forecasting to comb through huge datasets. It finds hidden patterns that might otherwise go unnoticed. For example, one study used semi-supervised learning with K-Means clustering on daily stock data, grouping price moves by their profit-to-loss ratios over different time frames. This approach showed that using numbers can back up and confirm chart patterns, giving traders a fair advantage when they’re making decisions.
By mixing these methods, raw price data turns into smart, workable signals. Modern tools blend traditional chart reading with advanced number-crunching techniques. Plus, using quantitative methods for market sentiment analysis adds an extra layer of insight into what’s coming next. In short, this combo of automated signal generators and strong statistical detection not only speeds up spotting patterns but also makes them more precise. The result is a proactive trading strategy that marries the art of reading charts with the science of data analysis to catch market shifts right as they happen.
Candlestick Arrangement Study and Momentum Shift Assessment
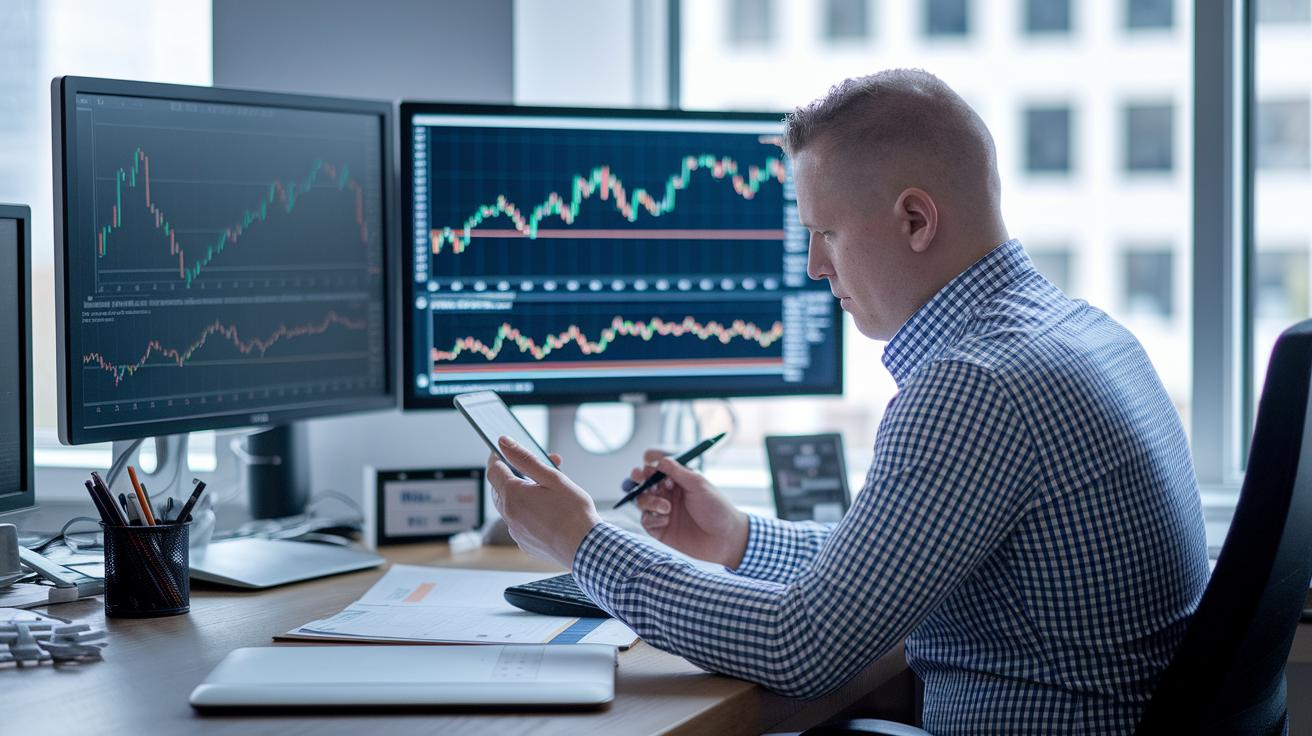
Trading platforms today come with smart visualization tools that help you spot candlestick patterns and groups of similar price moves effortlessly. Picture a chart where each candle acts like a mini scene in a play, giving you clues on where the market might head next. For example, when you see a sudden jump in trading volume paired with a unique candle formation, it can hint that market momentum is about to shift.
Real-time alerts and notifications make sure you never miss important moves. They prompt you to act quickly when something changes in the market. This is especially helpful when you're checking for differences between price and momentum (often called oscillator divergence), where traders closely watch price and volume changes to catch a turning point.
These enhanced tools also let you take a closer look at candlestick setups. They highlight patterns like long-legged dojis, which have tiny bodies with long shadows, and engulfing formations that offer early hints of a price change. You might even see clusters of similar candle shapes popping up on your screen, signaling that a trend might be brewing.
By combining these techniques, you can make smarter trading choices. This mix of insights, including watching volume surges, makes it easier to spot early signs of trend changes. For more on this, refer to charting in technical analysis.
Chart Patterns and Price Structure Examination for Signal Mapping
Traders often watch chart patterns to spot when prices might break out, reverse, or continue trending. Automated tools quickly scan charts for key shapes and sudden jumps in trading volume. For instance, seeing a rising wedge on the USDJPY 1-hour chart after several resistance tests might hint at a price surge. Similarly, a matching pattern on XAGUSD over 15 minutes could signal that a resistance retest is coming.
Techniques like Fibonacci retracement help measure how far prices might swing by tracking past movement. And familiar setups like flag or pennant patterns usually support the idea of a trend holding steady. One neat trick: notice when volume doubles during a breakout, it often means a strong move is about to start.
Putting these clues together builds a clear signal map, guiding you through breakouts, reversals, and continuations. Automated volume checks and straightforward price structures turn rough impressions into actionable insights.
Backtesting Methodologies and Signal Reliability Metrics in Pattern Recognition
Backtesting is a key part of any trading strategy that uses patterns. Traders lean on past price memory to check if their ideas really work over time. For example, you might simulate historical market events to see if a pattern, like the head and shoulders, accurately hinted at a trend reversal. Fun fact: during an AI internship, semi-supervised learning with K-Means clustering was applied on daily stock data to group profit-to-loss variations, boosting early trend signal confidence.
Autochartist's real-time alerts have come a long way. After more than twenty years of development, these modern tools now confirm clues by comparing historical price action and identifying key support and resistance levels (points where prices tend to bounce or drop). This means you can measure how reliable a signal is even before you place a trade. Many traders say that backtesting not only validates a pattern’s past performance but also reduces the guesswork that can cloud manual pattern spotting.
By mixing solid statistics with historical insights, you can better gauge both risk and reward. The approach usually involves matching old chart behavior with current patterns, making it easier to decide which signals are strong enough to act on. Step by step, these methods transform raw data into trustworthy signals that help build a robust trading strategy.
Integrating Risk Management with Data-Driven Pattern Recognition Techniques
When you use pattern recognition in technical analysis, it gives you clear signals for trades. But pairing these signals with strong risk management is key. Tools like economic event analysis, risk calculators, and news sentiment modules work together to give you the whole picture. They make sure the patterns you spot really fit with your position size and stop-loss plans, kind of like finding the perfect puzzle piece.
Trading costs such as spreads, margins, and financing fees also matter a lot when you plan your moves. Think of them as extra steps you need to factor into your profit and loss calculations. For example, if you notice an interesting chart pattern, reviewing the volatility spread can show you where to place your stop-loss. This helps lower the risk if the market suddenly turns against you.
Order flow dynamics let you see the energy behind a price move, so you can adjust your position size for expected shifts in the market. Here’s a quick guide on how to mix pattern signals with risk controls:
| Tip | Description |
|---|---|
| Risk Calculators | Match your trade size to expected volatility |
| Economic Event Check | Adjust orders during sensitive market times |
| Factor in Costs | Consider spreads and margins when setting profit targets |
This blend of clear, data-driven signals with smart risk fixes turns chart patterns into moves that feel a lot safer and give you more confidence when you trade.
Tools and Platforms for Automated Pattern Recognition in Technical Analysis
When you're looking for tools that automatically spot trading patterns, you'll find plenty of options built for speed and clarity. Many of these systems work on web browsers, mobile apps, TradingView, and MetaTrader 4. Some even offer premium upgrades like VPS support to speed up your actions. Ever seen a tool light up when a candle pattern or volume spike pops up? It's designed just for that.
Real-time signal checks are a big plus. These platforms pack smart features like advanced chart modules and spread calculators that help you decide when to enter or exit a trade. They turn complex data into easy-to-read graphics so even new traders can catch market hints.
If you get stuck or need a refresher, there are plenty of FAQs and guides built in to walk you through each tool’s features. For example, many come with a quick-start guide that shows you how layered signal filters transform raw numbers into clear, actionable insights.
Here are a few key benefits you might appreciate:
| Key Benefits |
|---|
| Simplified signal visualization |
| Mobile, web, and desktop access |
| Comprehensive user support |
All in all, these robust toolkits make it easy to weave pattern recognition into your everyday trading. They help you keep up with the fast-paced market while offering clear visuals and strong support, making your trading decisions a bit more confident each day.
Final Words
In the action, we explored how chart patterns, statistical signals, and candlestick setups work to shape trading decisions. The post unraveled ways to spot breakouts, confirm reversals, and optimize risk management while using pattern recognition in technical analysis. It also highlighted modern tools and backtesting methods that empower traders to refine strategies. Every point stressed turning raw price data into clear signals. We leave you inspired and ready to put these insights to work in your next trade.
FAQ
What information do PDFs on technical analysis and chart patterns provide?
PDFs on technical analysis explain how to spot chart patterns and read stock charts. They offer clear visuals and step-by-step details that help both beginners and experienced traders understand price movements.
How is pattern recognition in technical analysis implemented in Python?
Using Python, pattern recognition techniques analyze price data by coding algorithms that detect common chart formations. This approach automates chart review and supports faster, data-driven trade decisions.
How does chart pattern recognition using AI work?
AI-driven systems scan charts in real time, learning from historical data to quickly identify familiar price patterns. This automated process sharpens spotting potential trade opportunities with increased speed and precision.
How is pattern recognition applied in the stock market?
In the stock market, pattern recognition tracks recurring chart shapes that hint at trends. This method helps traders see potential price shifts and make more informed entry or exit choices.
What is pattern recognition analysis and is it good for trading?
Pattern recognition analysis examines repeating price configurations to forecast market moves. This method benefits trading by providing quick insights into trends and shifts, which can improve trading decisions when used with other tools.
What is the 3 5 7 rule in trading?
The 3 5 7 rule is a method used to confirm trading signals by observing price behavior over set periods. This rule helps determine if a pattern is strong enough to act on.
What are the three types of pattern recognition?
The three types typically include visual analysis, algorithmic scanning, and statistical methods. Each approach focuses on identifying familiar chart patterns and validating signals using different techniques.