


Have you ever wondered if forex charts might hide secret clues for profit? In the market world, every candlestick reflects a trader’s feelings, and technical analysis helps you notice a shift before it really happens. By looking at past trends and simple signals (hints about market movement), traders can spot opportunities that feel like little sparks of profit.
In this post, we share three easy-to-understand tips that might transform your trading game. Imagine reading a chart like reading your favorite story. History on a chart can hint at moments when the market is about to make a big move. Ready to take a closer look?
Fundamentals of Forex Technical Analysis: Tools and Strategies
Forex technical analysis is all about reading history to understand what’s happening in the market now. Prices move in patterns, an uptrend means prices keep making higher highs and higher lows, while a downtrend shows lower highs and lower lows. Before diving into charts, imagine a world where every candlestick tells a story of human emotion. These patterns repeat because they capture how traders feel, like the mix of fear and greed that drives our decisions.
At its heart, technical analysis means using simple tools like moving averages (the average price over a set time), oscillators (tools that help spot turning points), and volume indicators (which hint at how many trades are happening). Sure, volume can help confirm a breakout, but in forex, it’s not as reliable as in stock markets because the market isn’t controlled by one place. You often look at trend lines, support and resistance zones, and momentum signals to decide when to get in or out of a trade. Classic guides like Technical Analysis of the Financial Markets by John Murphy have taught many traders how to interpret these signs.
In short, understanding these fundamentals lets you see the market’s mood and make choices based on history rather than guesswork. By learning and using these tools, you can build strategies that help manage risk and navigate the fast-moving forex market.
Currency Chart Interpretation in Forex Technical Analysis

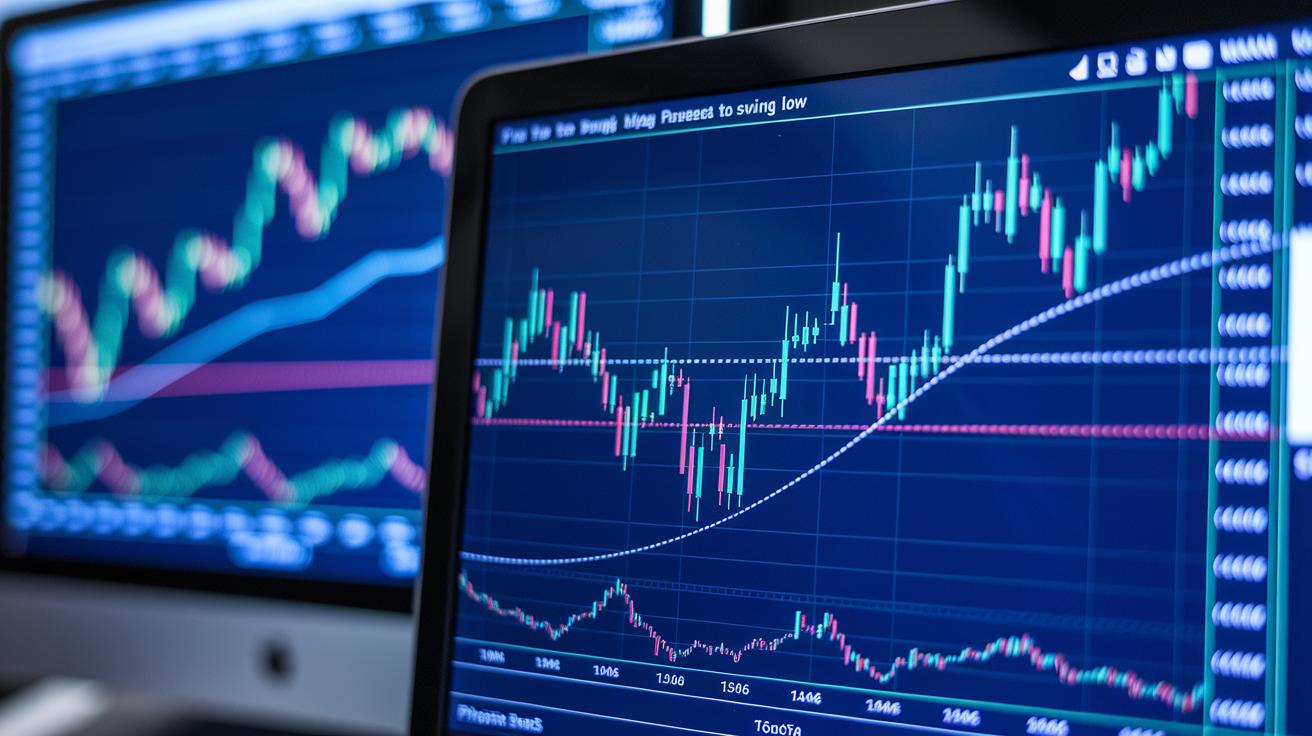
When you're diving into forex, charts act like your trusty map, guiding you through the market's ups and downs. Line charts keep it simple by showing only closing prices, so you can easily catch the long-term trend. Bar charts, on the other hand, give you a fuller picture, displaying the opening, high, low, and close prices, to help you see every twist and turn in price action.
Candlestick charts mix it up by adding details with bodies and wicks, making spotting reversal signals like hammers, dojis, or engulfing patterns much clearer. I remember a trader mentioning how a quick look at a doji once sparked a profitable idea. It’s these little details that can make a big difference when trading.
The timeframe you pick also matters a lot. Short-term charts might let you notice more candlestick patterns, while longer-term charts help you see broader trends. Live charts and rate tables update as you watch, so you can react quickly when the market shifts. Whether you're checking trends every day or watching minute-by-minute changes, picking the right chart is key for trusting your signals and timing your moves.
| Chart Type | Data Displayed | Primary Use |
|---|---|---|
| Line | Closing prices | Long-term trends |
| Bar | Open, High, Low, Close | Detailing price action |
| Candlestick | OHLC with body and wicks | Spotting patterns |
Choosing the right chart and reading it carefully can really help you catch potential swings in the market. This way, you can step in with confidence and make decisions that boost your trading game.
3 forex technical analysis insights spark profits
When you connect swing highs or lows with a line, you’re catching early clues about the market's direction. Picture it like drawing a road map that shows where prices have bounced in the past. This simple trend line can signal smart entry points, for example, linking several swing lows in an uptrend might show that buyers are stepping in.
A 20-day SMA smooths out those daily price ups and downs so you can see the overall trend more clearly. And when you watch a 10-day EMA cross over a 50-day EMA, think of it like a faster runner overtaking a slower one, hinting that the market’s pace might be shifting. You can check out more on connecting these swing points in the best practices of trend analysis linked here.
The RSI is another helpful tool. It alerts you when prices might be too high or too low, values over 70 suggest things could be overbought, while dipping below 30 might mean the market is oversold. One trader even shared how a sharp drop in RSI perfectly set the stage for a market rally.
Then there’s the MACD, which uses 12- and 26-day EMAs along with a 9-day signal line. When these lines cross, it can be a clear signal to look for an entry, especially if there’s a bump in trading volume during a breakout. Together, these tools, the trend lines, moving averages, and momentum checks, can help spark profitable insights in your forex trading journey.
Advanced Indicator Applications in Forex Technical Analysis
Advanced indicators can help uncover hidden signals in the market that may lead to profit opportunities. By using Fibonacci retracement levels like 38.2%, 50%, and 61.8%, you can spot potential entry points during price pullbacks. Picture drawing a Fibonacci line from a swing high to a swing low, it acts like a map, showing where prices might slow down or reverse.
Bollinger Bands are another useful tool. They set two standard deviations from a 20-day simple moving average, and they adjust as the market gets more or less volatile. When the price closes outside these bands, it often means a breakout is on the way. I remember one trader saying, “I once saw the price break out right after it closed outside the outer band, and that was my cue to enter.”
Daily pivot points, calculated as (High + Low + Close)/3, give you a simple way to predict potential areas of support and resistance during the day. Levels like S1, S2, R1, and R2 serve as markers where prices have historically taken a pause or reversed. Recognizing these zones can be key when you decide where to set your stop-loss orders or where to aim for profits.
• Always plot Fibonacci from the swing high to the swing low.
• Adjust the Bollinger period to match the asset's current volatility.
• Confirm pivot levels by checking past price actions.
• Use support and resistance zones to decide on your stop-loss levels.
Price Action and Oscillator Strategies for Forex Technical Analysis
Price action trading is all about watching the market move naturally. When you see a pattern where prices keep making higher highs and higher lows, it’s like watching a staircase steadily climb, each step building on the last. On the flip side, if prices show lower highs and lower lows, it tells you the market is on a downward path. One trader once said, "It’s like reading a story without words," to explain how these price moves reveal the market’s mood.
Oscillator strategies give you another tool by showing the market's speed or momentum. For example, the stochastic oscillator lights up when its value goes over 80, hinting that prices might be too high, or falls below 20, suggesting they could be too low. Think of it like a flashlight in a dark room, highlighting where the price extremes are hiding.
Another key idea is momentum divergence. This happens when prices hit new highs but the oscillator doesn't follow along. It’s a subtle clue that the current trend might be losing its strength, kind of like a runner slowing down just before the finish line. As one trader noted, "I saw the price jump without the oscillator following, and that tipped me off to a potential reversal."
Cycle indicators round out this approach by looking at repeating market patterns. They examine how long past price cycles lasted to help predict what might come next. So if you notice that a typical cycle spans a few weeks, you might see a similar pattern emerge again.
Together, price action and oscillators make a strong team. One shows you the market’s natural steps, while the other reveals hidden shifts in energy. This combo can help traders spot smart entry points with extra confidence.
Pattern Recognition Mastery in Forex Technical Analysis
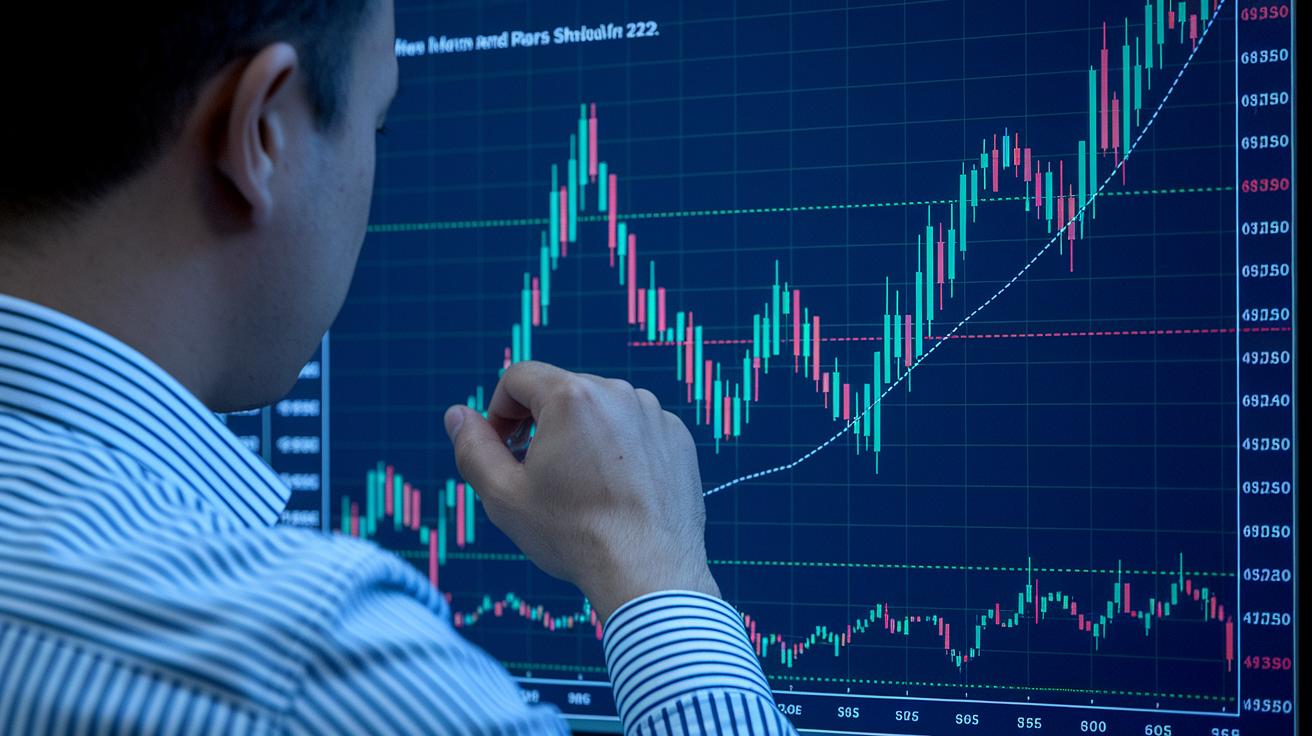
Chart patterns can feel like treasure maps if you know what to look for. Start with the classics, familiar shapes like head and shoulders or double tops and bottoms often hint that the market might be about to change direction. For instance, a trader might say, “I saw a head and shoulders pattern and felt the market was ready to flip.” Then, it’s smart to check volume (how much of an asset is being traded) to confirm that clue.
Continuation patterns also matter a lot. When you see charts with triangles, flags, pennants, or wedges, it can mean the market's just taking a little pause before moving in the same direction. Look for a surge in volume during these breakouts to be sure the move is real and not just random noise. It helps to compare these patterns across different currency pairs or even other assets like commodities or bonds, filtering out any false signals.
Candlestick patterns add another layer of insight. For example, a series of engulfing or doji candles might signal a reversal, especially when you see them alongside other chart patterns. More experienced traders often compare these signals with shifts in related assets to gain extra confidence before jumping in.
When all these techniques line up, you get a much clearer picture of where the market might be headed. This kind of methodical pattern spotting is a powerful tool in any trader’s kit, much like the tips you’d get from seasoned day traders.
Multi-Time Frame and Software Confluence Techniques in Forex Technical Analysis
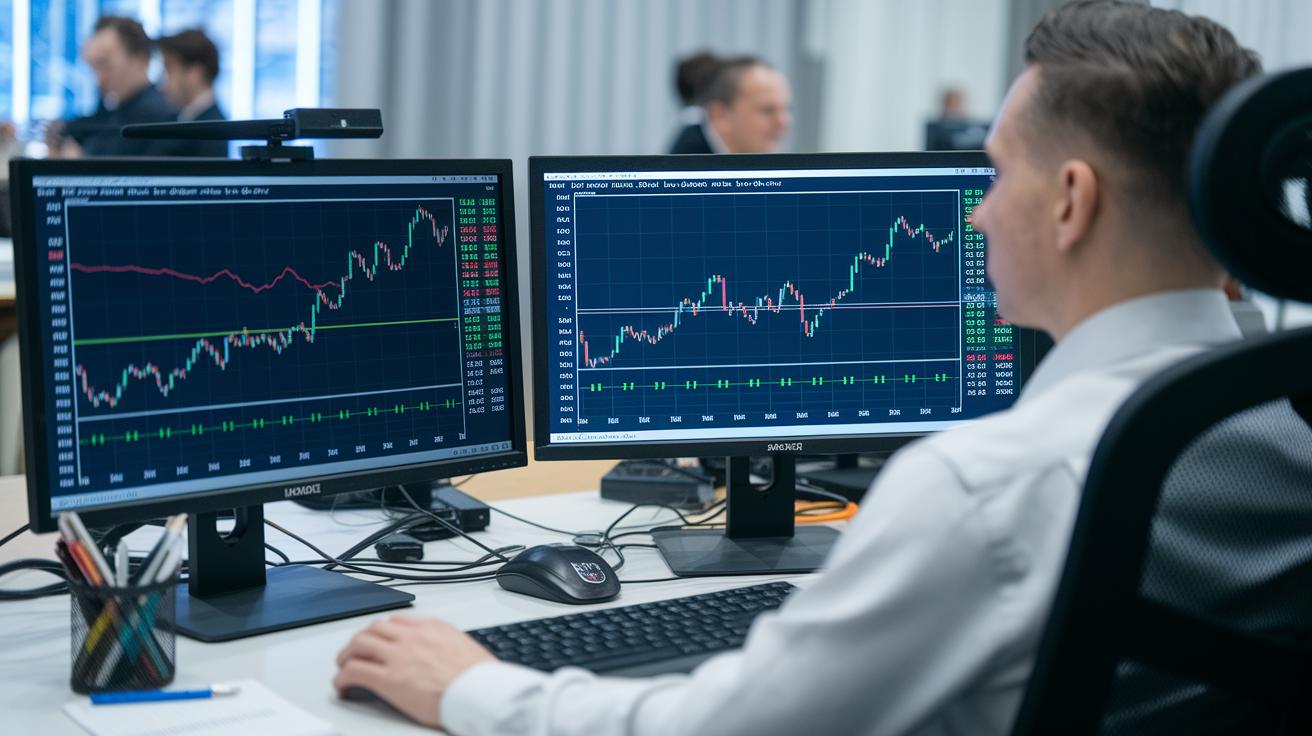
Imagine looking at the market from two angles at once, one from far away and one up close. When you check both daily charts and 1-hour charts, you see the broad market trend and the tiny details that confirm it. It’s like looking at a week’s weather forecast and then glancing outside to decide if you need that umbrella today.
Popular platforms like MetaTrader 4/5 and TradingView help keep things simple. They let you use custom scripts to automatically draw trend lines and Fibonacci levels (tools that help predict price movements). These tools even buzz you when the price hits an important spot. One trader said, "Seeing automated trend lines saves me so much time, letting me focus on decisions rather than hand-drawing each line." This kind of tech really streamlines your trading routine.
Then there are automated bots. They work around the clock, watching live price feeds and letting you know when a key setup appears, much like a friendly assistant always on guard. There are also technical confluence detectors that combine signals from several indicators into one clear alert, helping boost your confidence when you decide to jump in or step out of a trade.
Risk Management and Trade Execution in Forex Technical Analysis
Managing risk is all about protecting your money while letting your gains grow. A neat trick is to only risk about 1–2% of your account on each trade. I mean, one trader told me he never risks more than 1% per trade, and that approach really keeps unexpected losses at bay.
Set your stop-loss just a bit outside strong support or resistance areas, or beyond key pivot and Fibonacci points. This way, even if the price wiggles a little, it won’t wipe out your funds. Also, aim for trades where the potential reward is at least twice what you might lose. This mix of risk and reward helps you keep emotions out of your decisions.
Timing your market entry and exit is super important. Trailing stops can lock in profits as the price moves in your favor, kind of like a runner saving enough energy to sprint at the finish. And hey, keeping a trade journal is a great idea, it lets you see what works and fine-tune your strategy over time. Each trade adds up to a clearer picture of smart, steady trading habits that can build a disciplined approach and fuel long-term success.
Final Words
In the action, this article broke down the core principles behind forex technical analysis. It covered everything from reading charts and tracking trends to applying smart indicators and practicing good risk management.
Each segment showed how understanding historical price moves, patterns, and key signals can empower informed trades. With clear examples and expert tips, you can now approach market shifts with confidence and optimism. The tools and insights we explored make forex technical analysis a practical way to stay ahead.
FAQ
Where can I find a reliable forex technical analysis PDF or free download?
Reliable PDFs for forex technical analysis are available through reputable educational websites and industry articles, often featuring insights on trends, indicators, and chart patterns from key experts like John Murphy.
What is a recommended forex technical analysis book?
A highly recommended book is John Murphy’s “Technical Analysis of the Financial Markets,” which explains chart patterns, key indicators, and practical strategies used by experienced traders.
What forex technical analysis courses are available?
Forex technical analysis courses are offered by various online platforms that teach key methods such as trend evaluation, indicator studies, risk management, and live chart analysis for real-world trading.
What does forex technical analysis today cover?
Forex technical analysis today covers live chart reading, application of indicators like RSI and MACD, and use of software for multi-time frame reviews, helping traders spot current market trends.
How does a forex technical analysis app work?
A forex technical analysis app delivers real-time charting with overlays of popular indicators, trend lines, and pattern recognition tools, making it easier for traders to analyze the market on the go.
How does live forex technical analysis benefit traders?
Live forex technical analysis offers up-to-date charts, instant indicator signals, and real-time pattern recognition, which helps traders react quickly and adjust their strategies as market conditions change.
What careers involve forex technical analysis?
Careers in forex technical analysis range from trading desk positions to research analyst roles where experts use charts, trend lines, and risk management methods to support trading decisions.
What is the best technical analysis for forex?
The best technical analysis for forex combines chart patterns, trend lines, and indicators such as RSI, MACD, and Fibonacci retracements to provide a clear and actionable market view for trade setups.
Does technical analysis work in forex?
Technical analysis works in forex by interpreting historical price data to identify trends and patterns, thereby helping traders make better-informed decisions even when market emotions cause short-term fluctuations.
What is the 1% rule in forex?
The 1% rule in forex means risking no more than 1% of your account balance on a single trade to help protect your capital from significant losses during volatile market moves.
What is the 5-3-1 rule in trading?
The 5-3-1 rule in trading is a method that uses set price movement parameters over specific time intervals to guide trade entry and exit, maintaining a balanced approach to risk and reward.