


Ever thought a simple shape might be your next trading signal? Short-term chart patterns are like quick snapshots of the market, showing you when to jump in or step back. Picture a set of shapes on a minute-by-minute chart that capture traders’ feelings in real time.
In this chat, we'll break down how spotting formations like triangles, flags, and others can help you catch profit surges. Many traders swear by these fast tactics to grab short-term opportunities. Have you ever noticed how a small detail can change your whole approach? It's a simple tool that might just change the way you look at the market.
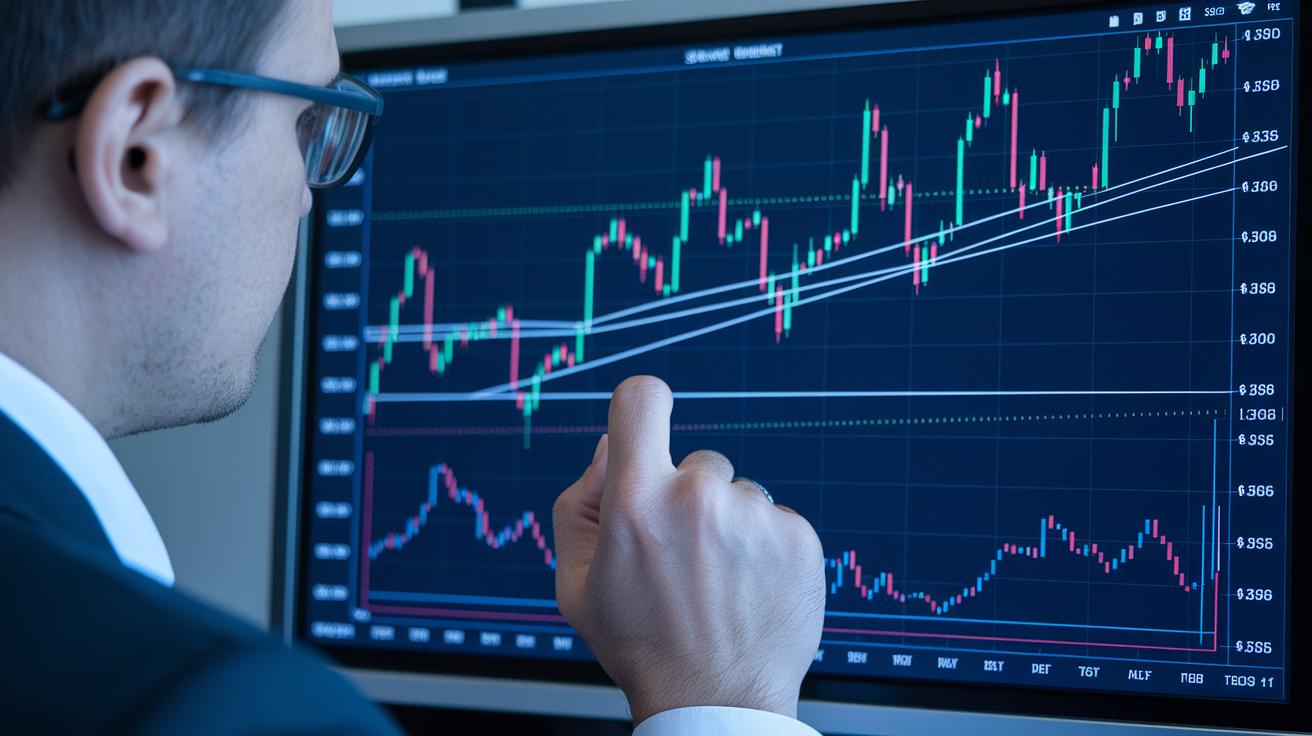
Day trading chart patterns Ignite Profit Surge

Chart patterns are the repeated shapes you see on short-term price charts. They help traders quickly decide when to jump in or get out of a trade, kind of like a snapshot of how the market feels right at that moment. On one- to five-minute charts, these patterns can tell you if a breakout or reversal is coming, and often you can see the move happen in just 5–30 minutes after the pattern finishes. Many traders hinge their timing on these signals so they can grab those short-term opportunities.
Learning these common patterns can really boost your trading game. Here are the top five formations to keep an eye on:
| Pattern | Description |
|---|---|
| Triangles (~30%) | These form when trendlines converge during consolidation. A clear breakout confirms a new move ahead. |
| Flags/Pennants (~25%) | You first see a strong price spike (the flagpole) followed by a short sideways channel. A breakout usually happens soon after. |
| Head & Shoulders (~10%) | This pattern shows a high peak in the middle with two smaller peaks on the side, suggesting the trend might reverse if the neckline is broken. |
| Double Top/Bottom (~8%) | It shows two similar highs (or lows), warning that the current trend may be losing strength once the formation completes. |
| Cup & Handle (~5%) | This one has a smooth, rounded bottom (the cup) and a small pullback (the handle), and it’s often a precursor to an upward move. |
These patterns provide a clear, structured way to spot quick changes in the market, so you can make confident, timely trades.
Recognizing bullish chart patterns in day trading

Ascending Triangle
The ascending triangle looks like a flat ceiling set above a series of rising steps. In simple terms, it has a straight top line made by a couple of similar high points and a rising line at the bottom made by higher lows. This shape tells us that buyers are slowly gathering strength to push the price above the flat ceiling. When you notice this pattern along with a sudden jump in trading volume, like 150% or more above the usual daily amount, you might expect a successful move upward about 65% of the time on an intraday trade. Think of it as a staircase that steadily climbs until it meets a flat roof, hinting that it’s about to break through when conditions feel just right.
Bullish Flag
The bullish flag pattern kicks off with a quick, sharp rise in price, which traders call a “flagpole.” Soon after, the price pulls back a little, forming a small, parallel downward channel, the “flag.” The trade becomes attractive when the price then moves out above the top of this small channel. To gauge where things might go next, traders often multiply the height of the flagpole by 1.2 to set a target price move. Imagine the flag snapping free in a strong wind: after a burst of upward speed, the price rests briefly before shooting up once again.
Cup and Handle
The cup and handle pattern features a rounded bottom that looks like you’re drawing a cup over 30 to 60 minutes. After the curve forms, there’s a small dip, a handful of bars that make up the “handle.” The move higher happens when the price climbs above the top of this handle, ideally backed by a boost in volume of around 1.3 times the average. Picture this as a teacup where the handle gently prepares you for a bold pour later. This formation signals that once buyers step in, the upward trend is set to continue.
Identifying bearish chart patterns for intraday moves

Descending Triangle
This pattern shows up when prices make two low points at nearly the same level, lining up a flat support line. At the same time, the high points gently slope downward. When that support finally breaks, traders like to see trading volume spike about 120% above the usual level to be sure the move is real. Often, the price will drop roughly 1.2% after the break, which can send a clear sell signal. It’s like watching a seesaw held still until one strong push sends it tipping over.
Bearish Flag
The bearish flag begins with a quick, steep drop that forms what traders call the flagpole. After that drop, the price drifts into a small, slightly rising channel that can last for five to fifteen bars. Many traders wait for the price to dip below the lower edge of that channel to start a new short position. They usually place a stop-loss just above the channel as a safeguard against sudden reversals. Imagine it as a brief pause in a falling market, a momentary calm before the downtrend picks up again.
Head & Shoulders Top
This pattern is made up of three peaks: a smaller one on the left, a taller middle peak (the head), and then another smaller peak on the right that looks similar to the left. The sell signal comes when the price falls below the “neckline,” which is the line joining the low points between these peaks. Generally, the drop is about twice the distance from the shoulder to the neckline, giving traders a clear target on the move. This setup is a handy tool for timing exits or even starting a new short position during the day.
Evaluating chart pattern reliability in day trading

Imagine having a simple cheat sheet that shows you how well a chart pattern has performed in the past. Traders look at historical win rates to get a sense of how often their setups might win. They also check the average move percentage to see what kind of profit they can expect and the frequency percentage to know how often these patterns pop up during the day.
For example, triangles usually win between 60% and 65% of the time and move an average of 1.3% in price, appearing in about 30% of situations. Meanwhile, the head and shoulders pattern may win 70% of the time and move 1.5%, but it shows up less often, only about 10% of the time. This simple data helps you decide quickly if a pattern is worth your attention when you see it forming on your trading screen.
| Pattern | Win Rate % | Avg Move % | Frequency % |
|---|---|---|---|
| Triangles | 60–65 | 1.3 | 30 |
| Flags/Pennants | 55–60 | 1.1 | 25 |
| Head & Shoulders | 70 | 1.5 | 10 |
| Double Top/Bottom | 58 | 0.9 | 8 |
| Cup & Handle | 63 | 1.4 | 5 |
Combining day trading chart patterns with technical indicators
Adding volume and momentum tools to your chart pattern analysis can make a big difference in timing your trades. When you see a breakout, check that the volume is at least 1.5 times higher than usual at the pattern’s edge, like a clear go-ahead signal that the price is ready to move. It’s a bit like noticing a strong green light in the midst of a busy intersection.
RSI divergence is another useful tip. If the price makes a new high or low but the RSI doesn’t follow suit, it often means the move is running out of steam. This little insight helps you dodge false moves before they catch you off guard.
The VWAP slope also gives you a peek at the overall trend during the day. By checking its direction, you can line up your pattern breakouts with the market’s mood. And if you’re curious about the details, looking into the VWAP trading strategy could shed more light on this idea.
A Bollinger Band squeeze within a pattern is another tell-tale sign, it usually means that volatility is about to kick in.
- Confirm breakouts when volume is at least 1.5 times the average.
- Look for RSI divergence at significant highs and lows.
- Use the VWAP slope to stay in tune with the broader trend.
- Watch for a Bollinger Band squeeze as a signal that volatility may soon increase.
Mixing these tools with clear chart patterns helps boost the accuracy of your intraday trading calls.
Developing day trading strategies around chart patterns

If you want to day trade using chart patterns, start with a clear plan. Decide in advance when you'll enter a trade, when you'll exit, and how you'll manage risks. When one candle closes above or below the pattern and you see solid volume, that’s your signal to jump in. As soon as you enter, set your stop-loss just inside the other side of the pattern. This way, if the market suddenly turns, your loss will be kept small. For example, if you're looking at a triangle, measure the distance from its top to its base and use that as your guide for how much profit you should aim for.
Make your trading routine a habit by sticking to a rule like a minimum risk-reward ratio of 1:2, and never risk more than 2% of your total money on a single trade. It might help to write down these rules in your own risk management plan to keep you on track. Some traders even note down the date, time, symbol, pattern, and result of each trade so they can learn and improve over time.
Remember, consistency is key. Every trade should follow the rules you’ve set, without letting your emotions take over. Stick with your plan, keep a close eye on your results, and adjust your strategy as you learn more. For more ideas and tips, check out extra day trading strategies to build a toolkit that really works for you.
Top tools and resources for day trading chart patterns

If you’re diving into day trading, using charting platforms like TradingView and ThinkOrSwim can really make your life easier. These platforms come with built-in scanners that highlight repeating price shapes, so you can quickly spot familiar patterns without getting lost in too many technical details.
It’s also a smart idea to use simulated sessions, like 1- or 5-minute setups, to practice your strategy before risking real money. For example, you might try a day trading simulator (https://cipherstonk.com?p=90) to get a feel for spotting quick triangles or flag patterns under real-life market conditions.
AI alerts add another layer of help by instantly warning you when a new pattern starts to form. And if you’re away from your computer, mobile apps with drawing tools let you mark trendlines on your charts wherever you are, keeping you ready no matter the situation.
| Feature | Benefit |
|---|---|
| Pattern Scanners | Quickly spot repeating price shapes |
| Simulated Sessions | Practice setups before live trading |
| AI Alerts & Mobile Tools | Stay updated on emerging trends and mark charts on the go |
Final Words
In the action, we explored how day trading chart patterns can pinpoint key moves and guide entry and exit decisions. We broke down top bullish and bearish formations, matched them with volume and momentum tools, and built a solid strategy around entry, stop-loss, and risk management. Each section offered clear insights into interpreting patterns and setting up trades with confidence, even when markets shift quickly. Keep these insights in mind as you refine your approach, and watch your portfolio grow with smart, informed moves.
FAQ
What are day trading chart patterns and why are they important?
Day trading chart patterns are recurring price shapes used by traders to predict short-term moves. They help spot entries and exits, with common examples like triangles, flags, and head & shoulders guiding quick decisions.
What bullish chart patterns can intraday traders use?
Bullish chart patterns, such as ascending triangles, bullish flags, and cup and handle formations, signal price rises when breakouts occur with strong volume. They provide clear cues for entering long positions in a rising market.
What bearish chart patterns do intraday traders often rely on?
Intraday bearish patterns include descending triangles, bearish flags, and head & shoulders tops. They indicate potential price drops, with breakdowns confirmed by increased volume, helping traders identify short-selling opportunities.
How reliable are these day trading chart patterns?
Chart patterns show varying reliability; for example, triangles may win 60–65% of the time with a 1.3% move, while head & shoulders patterns have a win rate near 70% with moves about twice the shoulder-to-neckline height, providing a performance benchmark.
How do technical indicators enhance chart pattern signals in day trading?
Technical indicators like volume, RSI, VWAP, and Bollinger Bands support pattern signals by confirming breakouts. They help filter false moves and ensure price action aligns with the broader intraday trend for more confident trades.
What strategies work well when trading based on chart patterns?
Effective strategies include waiting for the candle to close beyond the pattern edge with volume confirmation, setting stop-loss orders inside the pattern, maintaining at least a 1:2 risk-reward ratio, and keeping detailed trade records for ongoing refinement.
Which tools and resources are best for spotting day trading chart patterns?
Tools like TradingView and ThinkOrSwim offer pattern scanners, while simulated sessions, AI-generated alerts, and mobile apps with drawing features help traders practice and improve their ability to quickly spot and trade these patterns.