


Ever wondered if day trading can be both fast and rewarding? In the busy world of trading, clear signals work like a friend giving you a quick heads-up in a crowd. We’re sharing seven handy tools that help spot market shifts, catch breakouts, and highlight trends that matter.
These tools turn heaps of numbers into simple signs you can act on. With their clear markers lighting the way, you’re set to make quick decisions when the market moves. So, let’s jump in and explore how these signals can help you score speedy wins.
Top Technical Indicators for Day Trading
When you’re day trading, clear signals really help you act fast. It’s like cutting through a busy crowd to spot familiar faces. These tools turn a jumble of numbers into clear signs to follow, highlighting energy shifts, breakout moments, and overall trends that you can trust when time is short.
They’re picked for their knack to break down the market’s action right then and there. And they work on different time frames so you can get both the big picture and the tiny details.
- Moving Averages: They smooth out the price data over time, revealing the overall trend.
- Opening Range Breakout: It spots tight trading days to hint at when volatility might spike.
- MACD: This tool compares short-term and long-term averages to catch changes in momentum.
- Stochastic Oscillator: It looks at the closing price against a 14-period range to find potential reversals.
- RSI: It bounces between 0 and 100 to show if an asset might be too high or too low.
- Bollinger Bands: These bands use a moving average plus two outer limits (set at ±2 standard deviations) to gauge how volatile the price is.
- Fibonacci Retracements: They mark key support and resistance levels using Fibonacci ratios.
- VWAP: It provides a volume-weighted average price that traders often use as a daily benchmark.
- Money Flow Index: This one mixes price and volume to give you a sense of momentum.
- Ichimoku Cloud: It offers a broad look at market trends, with its leading spans flagging possible support and resistance levels.
Mixing these tools together creates a layered view that cuts through market noise. Using several signals at once helps confirm trends and cut down on false alarms, which is key when you need to make quick decisions in day trading.
Moving Averages and Trend Identification in Day Trading

Moving averages act like a steady guide through the ups and downs of day trading. They look back at past prices and smooth out the noise. A simple moving average treats every price the same, while an exponential moving average highlights the most recent prices. This tweak really matters when you’re trying to figure out the best times to jump in or exit a trade.
| Type | Calculation | Primary Use |
|---|---|---|
| SMA | Averages closing prices over a set period | Keeps the long-term trend clear |
| EMA | Weighted average that puts extra focus on recent prices | Quickly reflects changes in the market |
| Weighted Moving Average | Assigns different weights to prices | Strikes a balance between smooth trends and quick moves |
Traders often use settings like the 9/21 EMAs or 20/50 SMAs to get a quick read on market direction. The EMA’s fast reaction helps catch early shifts, but it might also trigger some false alarms in choppy markets. Meanwhile, SMAs offer a more stable look and work well to confirm trends. Weighted averages mix both worlds, giving you a smooth trend with the ability to react swiftly.
Oscillators for Trade Timing and Momentum in Day Trading

In day trading, the MACD is like your early warning system for shifts in market momentum. It compares a 12-period average and a 26-period average, then uses a 9-period signal line to spot changes. When the MACD line crosses above this signal, it often hints that prices might head up; a cross below can be a nudge that things could turn downward. Sometimes, if prices keep rising but the MACD starts to fall, it might signal that the strong momentum is fading.
The Stochastic Oscillator works by comparing the closing price to the range of highs and lows over the last 14 periods. When its readings near 80, it suggests that the asset may be peaking, and when it gets close to 20, it hints it might be at a low point. This tool is handy for noticing when the market is too hot or too cold in the short term. Plus, when its %K and %D lines cross, many traders use it as a signal to jump in or step out of a trade in fast-moving markets.
RSI swings between 0 and 100, giving us a simple way to see when the market might be overbought or oversold. Levels above 70 often signal that prices might pull back soon, while levels under 30 indicate that a rebound could be on the horizon. Some traders even check if the RSI and price are moving apart, which can tip them off to a potential trend change. Its clear cutoff points make the RSI an easy and effective tool.
The Money Flow Index, or MFI, mixes price action with volume (how much of an asset is traded), offering a more layered look at market pressure. Running between 0 and 100, high values on the MFI often hint at strong buying pressure, while low values can reflect heavy selling. Keeping an eye on the MFI as it breaks through key levels can help traders decide the best moments to enter or exit trades in these quick-moving markets.
Breakout Strategies for Day Traders: Opening Range and Volatility Breakouts

Range breakouts work on the idea that when a stock stays in a tight price range, it might be ready to burst out. Think of a stock stuck in a narrow channel for a few days, then suddenly jumping. That move signals a quick change that day traders can use to catch fast gains.
For the Opening Range Breakout, traders look at the smallest trading range from the last four or seven sessions. They mark the high and the low of that range and wait for the price to break out clearly in either direction. If it goes above the high, it may signal a friendly upward trend. If it falls below the low, traders might see this as a sign of a downward move. This strategy gives a clear signal for when to enter a trade and where to set stop-loss levels to manage risk.
Bollinger Bands help add more clarity by measuring market volatility. They are created using a simple moving average with two outer bands set at two standard deviations. When prices touch or move beyond these bands, it might mean a breakout is on the way, or perhaps the market is ready to reverse. Traders can then adjust their stop-loss orders, set their profit targets, or even close their positions to protect what they’ve gained.
Volume-Based Analysis for Short-Term Trades: VWAP Insights

VWAP stands for the Volume Weighted Average Price. It shows you the average price of a stock during the day, adjusted by how much was traded at each price. Imagine it as a daily report card that highlights where most trading happened while smoothing out random ups and downs.
Traders use VWAP in many different ways. One common strategy is the fade move, where the price falls back toward VWAP before bouncing off again. For instance, if a stock climbs above VWAP on strong trading volume, it might be a bullish hint and encourage taking a long position with a stop-loss set near the VWAP line. On the other hand, when the price dips below VWAP along with a spike in volume, it can signal a bearish turn, prompting traders to consider shorting the stock. This role of VWAP as both support and resistance helps traders judge if a breakout is strong and decide on the best moment to act.
However, VWAP may not always be reliable, especially during low liquidity periods. When fewer trades happen, the average might not truly represent what the overall market feels like. So, traders often combine VWAP with other tools to get a clearer picture before making a move.
Support and Resistance Levels: Fibonacci and Ichimoku Cloud in Day Trading
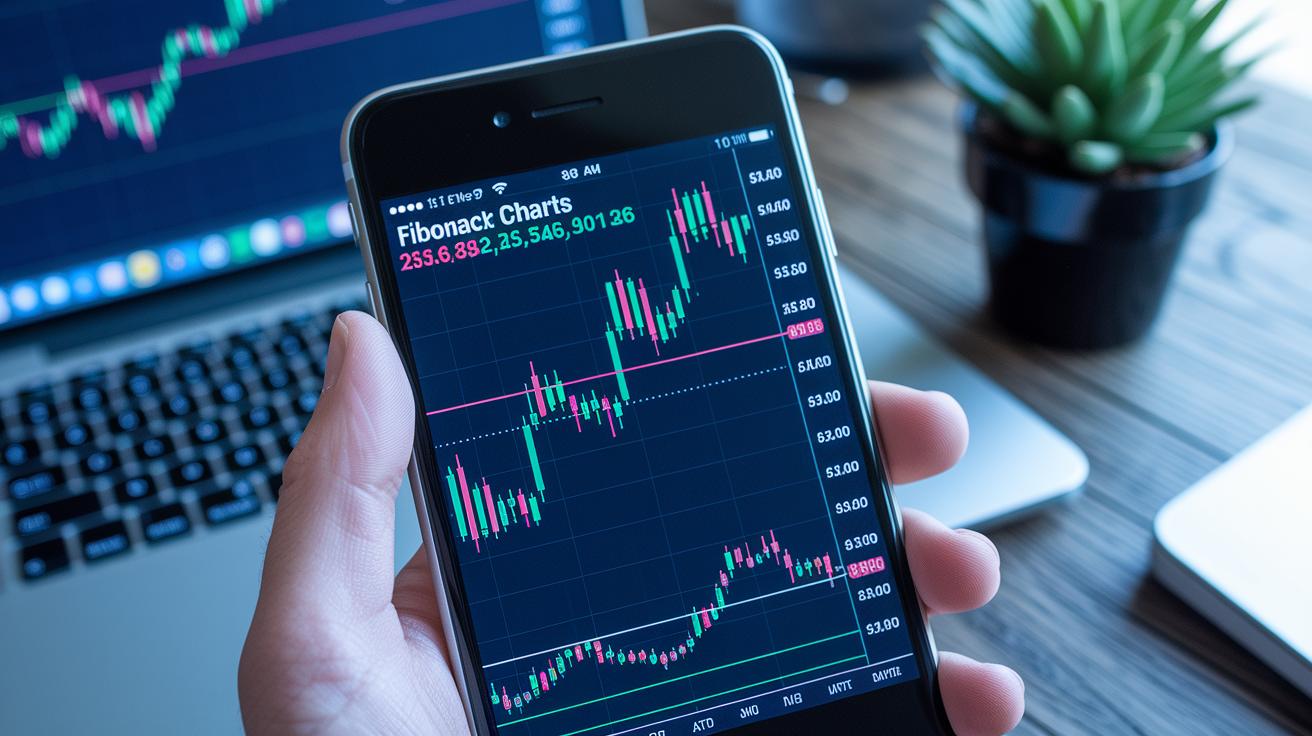
Fibonacci Retracements break a price swing into simple segments: 23.6%, 38.2%, 50%, and 61.8%. Traders use these clear levels as hints for when prices might change direction. So, if a stock’s price pulls back to the 38.2% mark, it can act like a floor, a signal that might suggest it’s time to consider entering the trade.
The Ichimoku Cloud offers a broad look at market strength and suggests where prices may find support or hit resistance. Its key parts, Leading Span A and Leading Span B, come together to form the “Kumo” or cloud. When prices stay above this cloud, it often means a bullish trend is in play, while falling below could mean a bearish move. A thicker cloud usually signals higher volatility, a hurdle that prices struggle to break through. For example, if the price hovers just above a thin cloud, it might show a weak but growing trend that traders confirm with other tools like trend lines or momentum indicators.
By mixing Fibonacci levels with insights from the Ichimoku Cloud, you can build a clearer trading plan for those fast-moving day trading situations.
7 best indicators for day trading: Fast wins

It all starts with combining several signals to build a strong trade setup. When different indicators come together, you get clear signals that boost your confidence. Imagine a moving average crossover lining up with an RSI divergence, it’s like getting a clear, friendly nudge to act fast.
First, pick your trend using a simple filter like a moving average crossover. Then check that the market’s momentum supports this trend with tools such as RSI divergence or even MACD shifts. Picture this: if your trend filter shows an upward move and the RSI bounces from oversold levels (meaning prices were low but are now picking up), that’s a strong cue to enter the market. This step-by-step method is like following a clear map when the market feels just right.
Next, double-check the trend with volume cues. A break above VWAP or a sudden spike in MFI can tell you that the move has real strength behind it. Once you’re sure about both trend and momentum, set clear entry signals and place your stops near key support or resistance zones, maybe a Fibonacci level, for example. And remember, plan your profit targets based on a risk–reward strategy to keep potential losses in check while aiming for solid gains.
Finally, test your setup by backtesting it over different sessions and market conditions. This hands-on trial lets you fine-tune your entry points, stop placements, and profit targets so every trade fits your risk management plan.
Final Words
in the action, we broke down a mix of tried-and-true tools that help shape every day trader's game plan. We touched on methods like moving averages and oscillators, paired with breakout strategies and volume analysis to spot key price shifts. We also explored support/resistance techniques such as Fibonacci and the Ichimoku Cloud for added confirmation.
By combining these insights with careful trade setups, you're set to use the best indicators for day trading and build confident, informed strategies.
FAQ
Q: What are some of the best indicators for day trading across popular platforms?
A: The best indicators for day trading on platforms like Reddit, TradingView, and Webull often include moving averages, oscillators, and volume-based tools; these offer flexibility, fast signals, and customizable settings for different asset types.
Q: What are the top trading indicators used by day traders?
A: The top trading indicators include moving averages for trends, MACD for momentum, RSI for overbought or oversold conditions, Bollinger Bands for volatility, and Fibonacci retracements to spot key support and resistance levels.
Q: What is the best indicator for entry and exit?
A: The best indicator for entry and exit combines trend analysis with momentum measures, such as pairing moving averages with oscillators like RSI, which helps pinpoint clear buying and selling moments in fast-paced trading.
Q: What are the “big 3” indicators?
A: The term “big 3” indicators usually refers to moving averages, MACD, and RSI, as they quickly show market trends, price momentum, and potential reversal points, making them a solid foundation for day trading decisions.
Q: Are any indicators 100% accurate or have the highest success rate?
A: No indicator is 100% accurate; even top performers need validation through additional signals and proper risk controls to minimize false triggers and manage losses effectively.
Q: What does the 2% rule mean in day trading?
A: The 2% rule means that you risk no more than 2% of your trading account on any single trade, protecting your capital by limiting losses during volatile market movements.
Q: How do day trading signals assist traders?
A: Day trading signals combine insights from various technical tools to flag potential entry and exit points, helping traders make quick, informed decisions amidst fast-moving market conditions.