


Ever wonder if the market is trying to drop hints about its next move? Basic technical analysis shows us that each tiny tick on a chart can reveal a trader’s mood or decision. Long ago, a smart trader used simple charts to watch rice prices, and today, traders follow similar patterns with stocks, digital currencies, and more.
Think of these charts as a series of building blocks. When you spot the right pattern, it might give you a clue for a smart move. In this post, we break down the basics to help you start reading the market with fresh eyes.
Fundamentals of Basic Technical Analysis
Technical analysis got its start back in 17th-century Japan when a trader named Munehisa Homma began using candlestick charts to track rice prices. Today, U.S. methods, developed around 1900, rely on one simple idea: the price shows everything already known. In other words, any news or feeling about the market is built right into the price, and trends tend to happen over and over again. For example, in a rising market, traders watch for prices that form higher highs and higher lows. Think of each peak and dip as a building block stacking up to form a strong, bullish trend.
This idea works because people often repeat similar behaviors over time. The patterns we see on charts come from the same choices investors make again and again. As a result, these patterns become useful clues about where prices might go next. Technical analysis is used for stocks, forex (which means trading different currencies), crypto (digital currencies), and commodities (like gold and oil). Every candlestick, line, or bar on a chart offers a small peek into what traders might be feeling or expecting. And with tools like trend lines, moving averages, and support/resistance zones, it becomes a bit easier to predict future moves.
A must-read resource for anyone starting out is Technical Analysis of the Financial Markets by John Murphy (https://nftcellar.net?p=1352). By getting the hang of these basics, you can start making smart moves in the market using a clear, evidence-based method.
Reading Charts in Basic Technical Analysis

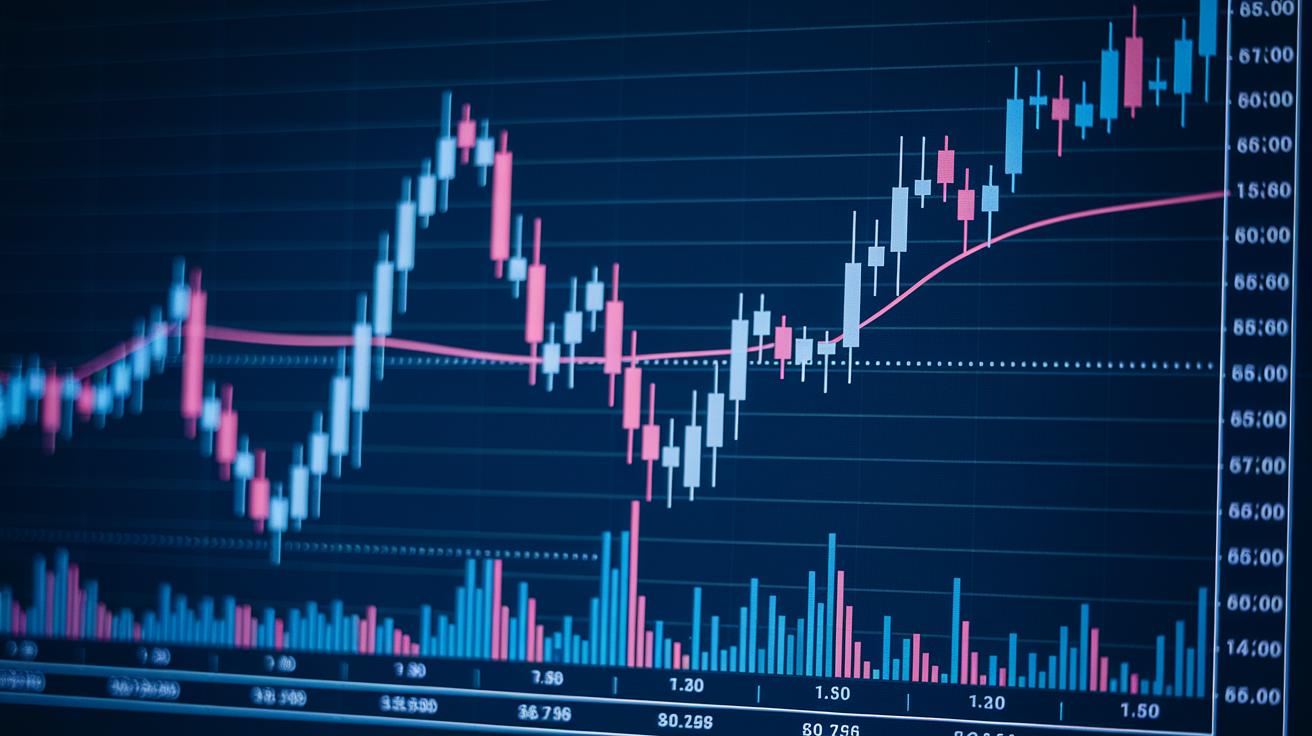
Charts come in many forms, and each one gives you a peek into the market’s moves. Line charts are simple, they only show the closing prices, giving you a smooth picture of how prices have changed over time. Bar charts tell a fuller story by showing the open, high, low, and close (OHLC), which can hint at what traders felt during the day. Candlestick charts go a step further by showing both the body and the wicks, revealing little details about investor behavior. For instance, a small body with long wicks, called a Doji, often means that traders aren’t quite sure which way the market will go.
When you check out OHLC data, remember those four numbers matter. The open starts the story, the high and low show the day's extremes, and the close wraps everything up. Picture each number as a puzzle piece that, when combined, paints a clear picture of the market mood.
It’s also important to tell the difference between trending and ranging markets. In a trending market, you’ll see a pattern, like prices that keep getting higher highs and higher lows in an upward trend, or the reverse in a downward trend. In a ranging market, prices usually move sideways between familiar levels of support and resistance. Think of support as a floor where buyers step in, and resistance as a ceiling where sellers hold their ground. Often, higher trading volume backs up these areas, giving you extra confidence in what the chart is showing.
By mastering these chart techniques, you start to speak the language of the market. Each chart type is like a clue in a fascinating puzzle, sometimes a simple signal like a hammer pattern can hint that something big might be about to change.
Indicators in Basic Technical Analysis

Moving averages are a favorite tool for calming bumpy price data into a smooth trend. The simple moving average (SMA) gives you an average price over a set number of periods, so you see the overall trend clearly. On the other hand, the exponential moving average (EMA) puts extra focus on recent prices, making it react faster to quick changes. Many traders keep an eye out for when, say, the 50-period SMA jumps over the 200-period SMA, a crossover that can feel like a spark lighting up the market.
Momentum indicators add another layer to your market view. The Relative Strength Index (RSI), often set at 14 periods, tells you how fast prices are moving and signals if an asset might be overbought (above 70) or oversold (below 30). The Stochastic Oscillator compares the current price to its usual range over a set time, helping you spot potential trend reversals.
Then there's the MACD, which is found by subtracting the 26-period EMA from the 12-period EMA. When this line crosses its signal line, it can guide you on whether to buy or sell. And don't forget about volume, tracked by the On-Balance Volume (OBV) indicator, it shows whether trading is picking up or slowing down.
All these indicators work together like pieces of a puzzle, painting a fuller picture of market trends and investor sentiment. They help traders make quick decisions in busy markets, turning complex data into a clear call to action.
Pattern Recognition in Basic Technical Analysis

Chart patterns are a key tool for smart moves in the market. Traders often look for reversal patterns like double tops and bottoms, head and shoulders, or even triple tops and bottoms. Picture a double top as two similar peaks on a chart that might hint at a coming drop.
Reversal patterns show us when market feelings might change, while continuation patterns such as flags, pennants, and rectangles suggest a trend may take a short break before picking up again. If you spot a flag after a steep rise, it could be a sign that the market is pausing briefly before climbing higher once more.
Learning about support and resistance is also important. These zones indicate where buyers or sellers have stepped in to push prices in the opposite direction. When these zones line up with Fibonacci retracement levels (like 38.2% or 61.8%), they create confluence zones, stronger signals that can make predicting market moves a bit easier.
Then there are wedges and triangles. Wedges, with their trendlines that converge together, often hint at a pullback close to 38.2% of the last move. Meanwhile, triangles, whether symmetrical, ascending, or descending, point to moments of uncertainty or a market leaning in one direction, adding another layer to our chart pattern study.
Entry & Exit Strategies in Basic Technical Analysis
Clear entry signals tell you when it’s a good idea to dive into a trade. Watch for a breakout above resistance, in simple terms, when the price pushes past a level it usually can’t cross. Picture a sprinter blasting off the starting line at the sound of the gun. A moving average crossover, like when a short-term average such as the 50-day line crosses above a long-term one like the 200-day, often hints at a change in momentum (that’s the force behind a price move). Also, keep an eye on RSI divergence. RSI, or Relative Strength Index, shows if the market is overbought or oversold. When it diverges from the price trend, it might mean the market is stretching too far and could be ripe for an entry.
Exiting is just as important as entering. If the price reaches your target based on your risk-reward setup, for instance, if you aim to earn two dollars for every dollar you risk, it might be time to take profits. Also, watch out for bearish reversal patterns (signals that the price might start dropping) or an overbought oscillator (an indicator showing that the price may have climbed too high). These clues suggest you should exit before the market turns.
Don’t forget about your stop-loss, it’s your safety net. Place your stop-loss just below a support level or the most recent swing low to safeguard your trade. The idea behind risk-reward is simple: measure the distance (in pips or points) from your entry to your stop-loss and compare it to your target gain. For example, if you risk 10 pips, you might aim for a 20-pip gain.
- Entry signals: Breakout above resistance, moving average crossovers, and RSI divergence.
- Exit signals: Hitting your target based on your risk-reward ratio, bearish reversal patterns, or an overbought oscillator.
- Stop-loss: Set just below a support level or recent swing low.
- Risk-reward: Calculate pip/point distances to keep a favorable balance.
And for some hands-on learning, try paper trading to practice your strategies without real money, more details can be found here: https://cipherstonk.com?p=99.
Risk Management in Basic Technical Analysis

Smart risk management is all about protecting your money when you trade. One handy trick is to size your trades based on the Average True Range (ATR). ATR gives you a clue about how much prices might change in a certain time. This helps you decide the right position size. Other tools, like Bollinger Bands, do something similar. For example, if the bands are close together, it may mean the price won’t move much. But if they're far apart, expect more ups and downs.
Volume is also a big part of the picture. A sudden jump in the number of shares traded can signal a real breakout, while low volume might hint at false signals. This extra check boosts confidence in your risk management plan. And don’t forget diversification. By spreading your trades across different assets and timeframes, you can reduce the risk of big losses from one area.
Using trailing stops based on ATR multiples is another smart move. They adjust as the market moves, helping you lock in profits without stopping you out too early. Combined, these techniques form a simple yet strong strategy that keeps your focus on trading wisely and protecting your capital. Make sure to check these methods regularly to stay flexible in an ever-changing market.
Final Words
In the action, we explored the core ideas behind basic technical analysis, from chart reading and indicator signals, to recognizing patterns and fine-tuning entry and exit strategies. Each section gave us a clear view of how market behavior, trends, and risk management work together to guide smarter decisions. This clear breakdown can help turn complex data into manageable insights, all aimed at helping you build a stronger trading foundation. Keep learning and applying these principles for a more confident market experience.
FAQ
What is basic technical analysis?
Basic technical analysis is a method that uses historical price and volume data to spot trends and assess market behavior. It builds on the idea that current prices reflect all known factors.
How do technical analysis PDFs and books help traders?
Technical analysis PDFs and books offer clear guides that cover chart reading, key indicators, and trading strategies. They serve as practical resources for traders at any experience level.
How is basic technical analysis applied in forex trading and other markets?
Basic technical analysis in forex and other markets uses price history, chart patterns, and indicators to forecast future moves. It helps traders recognize trends and recurring market behavior.
What does a basic technical analysis chart show?
A basic technical analysis chart displays price movement using line, bar, or candlestick formats. It visually represents trends, support and resistance zones, and shifts in market sentiment.
What are common technical analysis patterns and types?
Common patterns include reversal designs like double tops and bottoms, and continuation shapes like flags. Types of analysis focus on price action, momentum, and volume to predict market changes.
What is the 7% rule in stock trading?
The 7% rule in stock trading is a guideline suggesting that traders consider exiting a position if a stock loses 7% of its value, helping to control risk and protect capital.
How should beginners approach technical analysis?
Beginners can start by learning chart reading, understanding indicators such as moving averages and RSI, and practicing with simulated trades. This builds confidence in recognizing trends and signals.
What are the 4 pillars of technical analysis?
The four pillars of technical analysis are price, volume, time, and market psychology. These elements work together to help traders interpret historical data and predict future price moves.