


Have you ever thought about how global stock market indexes might help you spot smart trends? They give you a quick look at how different groups of stocks are doing, turning a complex market into something clear and simple.
In this article, we're diving into well-known benchmarks like the S&P 500 and Nikkei 225. We break down the patterns and shifts that can guide your investment ideas. With clear numbers and real-life examples, you'll see how the pulse of the global market can point you toward new opportunities.
Stick with us as we take a straightforward look at these dynamic trends, just like chatting with a friend about the ups and downs of the market.
Global Stock Markets Indices Overview and Top Benchmarks
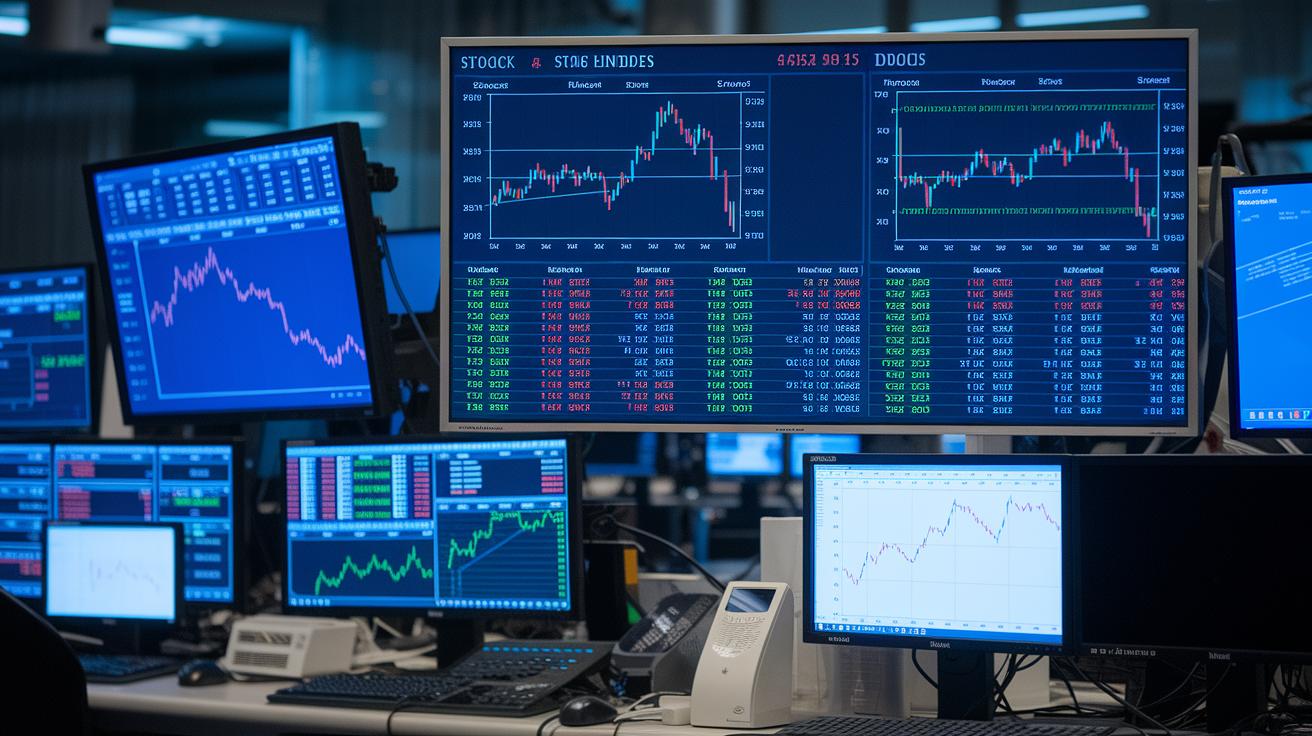
Indices are like quick snapshots that show how groups of stocks are doing. They let you see how a slice of the economy is performing, which can help you spot potential opportunities. If you’re curious, check out this global markets definition for more details.
They’re a big help when making investment choices because they reflect the overall market health. Investors use these numbers to compare different regions and sectors, deciding where to put money based on trends and past performance.
| Index Name | Region | Latest Level | 1-Year Performance |
|---|---|---|---|
| S&P 500 | USA | 4,200 | +8% |
| FTSE 100 | UK | 7,000 | +4% |
| Nikkei 225 | Japan | 30,000 | +15% |
| DAX | Germany | 15,500 | +6% |
| Hang Seng | Hong Kong | 20,000 | -5% |
| Shanghai Composite | China | 3,200 | +3% |
| Sensex | India | 60,000 | +10% |
| Bovespa | Brazil | 120,000 | +2% |
| CAC 40 | France | 6,500 | +5% |
| ASX 200 | Australia | 7,500 | +7% |
This table gives you a quick look at main benchmarks from different regions. It shows which indices are booming and which ones are falling behind. For example, the Nikkei 225 shines as a top performer, while the Hang Seng dips a bit, showing that not all regions move the same way. This mix gives investors a real sense of the market’s mood and helps decide where to invest next.
Regional Perspectives on Global Stock Markets Indices

Looking at market indices organized by region helps us see how different parts of the world move financially. Emerging and developed markets often respond in their own way to economic changes, policy shifts, and the feelings of investors. For example, emerging market benchmarks might surge during growth times but can also be more sensitive when uncertainty hits. This closer look lets investors adjust their strategies, mixing promising trends with the steady feel of developed markets. For the latest updates, check out "global stock markets today" at https://cipherstonk.com?p=285.
| Top 7 Emerging Market Benchmarks |
|---|
| Bovespa (Brazil) |
| Sensex (India) |
| Shanghai Composite (China) |
| MSCI Emerging Markets |
| KOSPI |
| S&P/TSX |
| JCI |
| Top 7 Developed Market Indices |
|---|
| S&P 500 (USA) |
| FTSE 100 (UK) |
| Nikkei 225 (Japan) |
| DAX (Germany) |
| CAC 40 (France) |
| ASX 200 (Australia) |
| MSCI World |
These tables show how markets differ from one region to another. Emerging markets might have high energy and quick moves, while developed indices offer a more steady footing. Knowing these differences helps you decide how to spread your investments, whether you're chasing growth or looking for stability. It’s all about balancing opportunity and comfort in a changing world.
Historical Performance Trends in Global Stock Markets Indices
Looking back at past market cycles helps us understand how long-term trends shape today’s conditions. Checking out decades of performance gives us clear clues about recurring patterns in global indices. This simple look into history can guide us in making smarter investment choices.
Over the last 10 years, the S&P 500 mostly trended upward during a strong bull run fueled by new ideas and steady growth. Up until 2020, investors felt optimistic, which pushed the index to record highs. But when the pandemic hit, the market quickly pulled back. Soon after, new economic policies and renewed confidence sparked a rapid recovery.
The Nikkei 225, Japan’s leading index, moved at a slower pace. Before 2020, its progress was steady but not as dramatic. When global uncertainties set in, it dropped more sharply and took its time to bounce back. This slower recovery reflects a gentler shift in investor sentiment and different local policies.
Looking even further back to the years after the 2008 crisis, the S&P 500’s fast rebound stands out compared to the more measured pace of the Nikkei 225. Different factors like changes in rules and the way local consumers spend their money play a big role in these differences. It’s a good reminder to watch these market shifts when planning future investments.
[Insert Line Chart Visual: S&P 500 10-Year Price Series]
[Insert Line Chart Visual: Nikkei 225 10-Year Price Series]
These repeating cycles of market ups and downs show us that recoveries and downturns often follow a pattern. Understanding these cycles can be a helpful tool for guessing what the market might do next.
Economic and Geopolitical Drivers of Global Stock Markets Indices
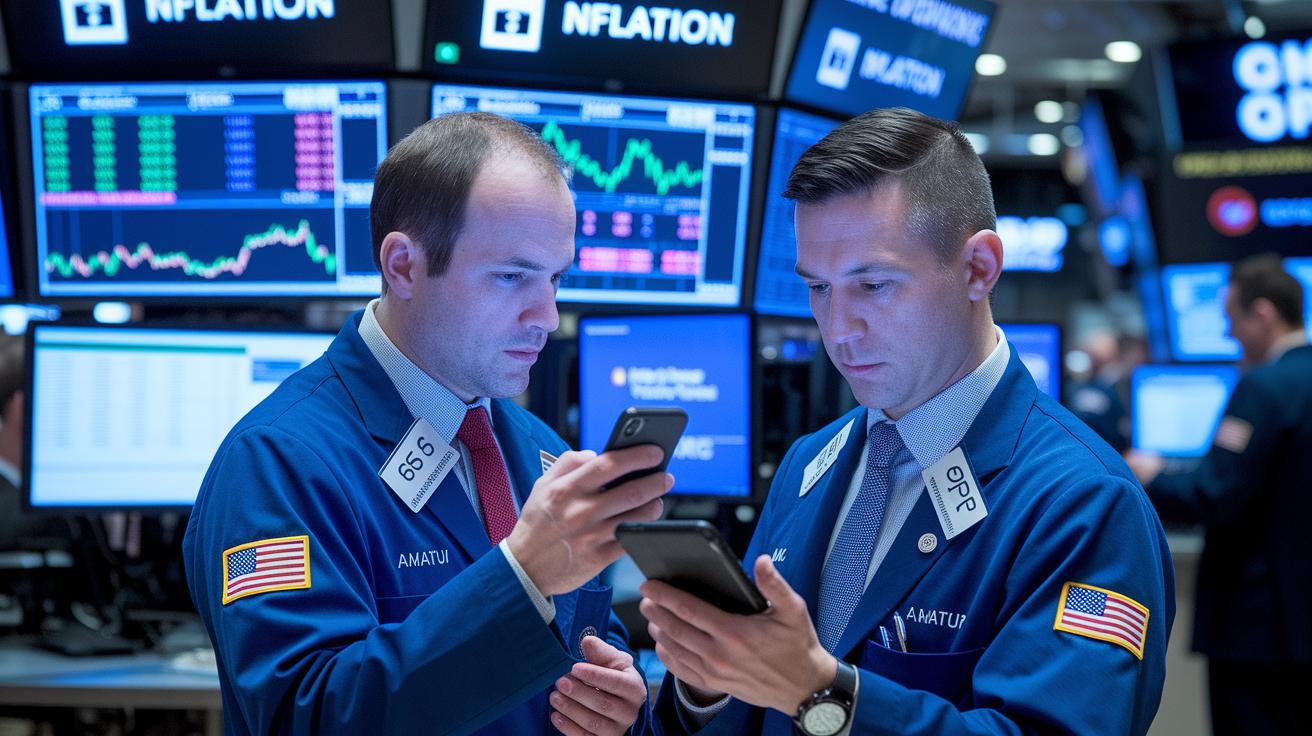
Global markets often groove with shifts in big-picture economic numbers like GDP growth, interest rates, and inflation (rising prices that affect everything you buy). When GDP climbs, companies usually earn more, and that bolsters investor confidence. On the flip side, higher inflation can squeeze what people spend, potentially pushing central banks to raise interest rates. It’s a bit like watching a thermometer, when the numbers change, so does the mood of investors about future earnings and the overall market vibe.
Geopolitical events add another twist. Political decisions, think trade policies, diplomatic squabbles, or even new sanctions, can send waves through the markets. For instance, a guide from Citi once suggested sticking with US stocks until certain market signals pointed to a sell-off. Political moves and international disputes tend to shake up investor views in a flash, making the market feel a bit unpredictable.
And then there are the sector-specific sparks. Changes in technology trends, shifts in energy prices, or groundbreaking innovations can light up rallies or trigger dips. Imagine a major tech firm announcing better earnings or the energy market doing unexpected flips; these moments ripple out and influence the indices. While the overall trend is important, the little details in each sector are what often drive the momentum.
In essence, the market is like a living tapestry woven from economic trends, political events, and industry shifts. It’s this blend that shapes stock market indices and helps investors navigate the ever-changing financial landscape.
Assessing Volatility and Risk in Global Stock Markets Indices

Volatility shows us how much prices bounce up and down, it’s like the market’s heartbeat. When that pulse quickens, it might be a hint that the market is either nervous or cooking up new opportunities.
Understanding risk comes down to a few simple numbers. Standard deviation, for instance, tells you how far prices stray from the average over time. Beta compares a stock’s moves with the whole market, giving you a quick snapshot. And when you look at the VIX, it's like measuring overall market jitters; higher numbers usually mean uncertainty. These measures help you gauge the risk level when exploring different market indices.
Recent trends remind us that each index has its own personality. The S&P 500 tends to move steadily with gentle ups and downs, while Hang Seng sometimes takes sharper, more dramatic dips. Bovespa, in contrast, has its own unique swings that shift with regional economic changes. It’s interesting to see how these differences can shape your investment strategy.
For those active in the markets, using real-time dashboards and volatility tools is a smart move. They work a bit like a weather app for stocks, letting you adjust quickly as market conditions change. Have you ever felt the need to pivot when the market took an unexpected turn? That's the insight these tools can bring.
Charting and Forecasting Techniques for Global Stock Markets Indices

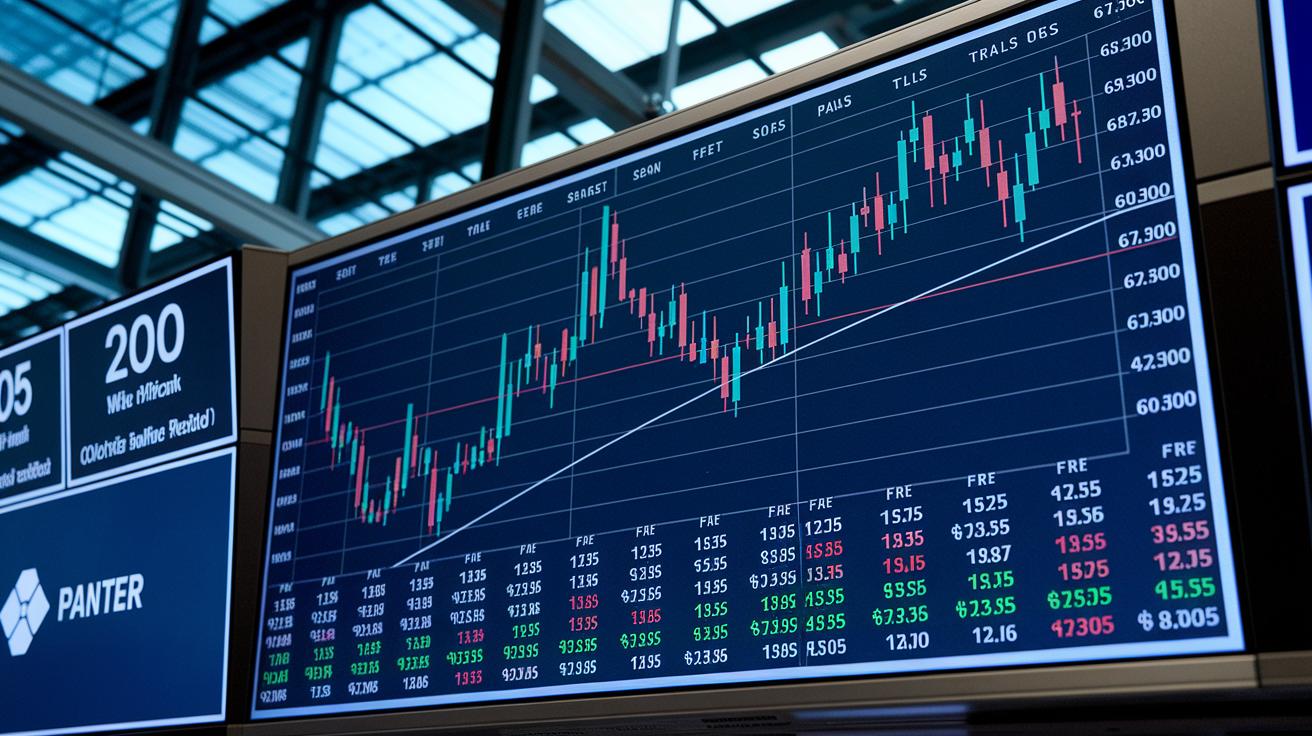
Charting gives you a visual look at how markets move, making it easier to see trends and patterns. For example, picture a simple line graph of the S&P 500 with its ups and downs, much like a heartbeat guiding your next move.
Technical indicators are handy tools that turn market data into clear signals. Moving averages smooth out price swings to show overall trends, while the Relative Strength Index (RSI) helps spot if an index is too high or too low. Imagine an S&P 500 chart with a 50-day moving average and RSI markers, it’s like checking the market’s pulse. Many traders use these visual clues to decide when to buy or sell.
Fundamental forecasting mixes numbers with real-world insights. Key ratios like the price-to-earnings (P/E) ratio and yield curves give a snapshot of a company’s value and the health of the economy. By watching economic news and earnings reports, you build a forecast that combines raw numbers with market mood. This approach helps explain why an index such as the S&P 500 reacts to changes in profits or interest rates.
Mixing visual analysis with hands-on data deepens your market understanding. Using both technical charts and fundamental measures gives you a fuller picture of global market movements, which makes planning your next investment move feel more natural.
Constructing a Diversified Portfolio with Global Stock Markets Indices

Mixing your investments across different regions and industries is a smart way to spread risk. When one market struggles, another might be thriving, which can cushion your portfolio from sharp downturns. For example, blending investments in well-established markets with those in emerging ones can help even out the ups and downs.
A solid portfolio often combines stocks and bonds. Stocks offer the chance for growth, while bonds deliver steadier returns. By including bond ETFs in your mix, you can gain a smoother ride even during wild market swings. It’s like balancing a bit of excitement with a dose of stability.
Many investors choose ETFs and index funds because they mirror market trends while keeping fees low and access simple.
It’s also a good idea to review and adjust your portfolio regularly. Whether you set a schedule or use market triggers, rebalancing helps you stick to your planned asset mix even when things change fast.
Finally, match your investment strategy to the level of risk you’re comfortable with. Think about how much fluctuation you can handle, and tweak your holdings as global trends shift. With regular check-ins and adjustments, you can manage risks while staying ready to grab new market opportunities.
Final Words
In the action, we explored the pulse of market trends through global stock markets indices, detailed benchmark comparisons, and the forces shaping them. We looked at historical data, regional contrasts, risk factors, and forecasting approaches, then tied them to practical portfolio strategies.
This recap reminds us that each insight, from volatility measures to diversification techniques, helps make sense of fast-moving markets. Stay eager, keep learning, and let this knowledge boost your market strategy with global stock markets indices.
FAQ
World market index live
The world market index live shows a real-time snapshot of key global benchmarks, helping investors catch current market movements at a glance.
Global stock markets indices list
The global stock markets indices list compiles major benchmarks like S&P 500, FTSE 100, and Nikkei 225, offering a quick reference to track different regions’ performance.
Global stock markets indices chart
The global stock markets indices chart visually displays trends and performance metrics of key indices, making it easier to track market movements over time.
Major world indices live
The major world indices live update in real time, giving an immediate view of performance across various markets to inform timely investment decisions.
Global stock market graph
The global stock market graph presents visual comparisons of index performance, helping investors quickly understand shifts and trends across international markets.
Global market live Future
The global market live future provides forward-looking data and real-time updates, offering insights into upcoming market trends to aid in planning investment strategies.
World stock index graph
The world stock index graph visualizes international market performance, enabling users to compare trends and gains across different global benchmarks.
Global market News
The global market news covers updates on economic events and policy changes affecting key indices, providing investors with timely context to adjust their strategies.