


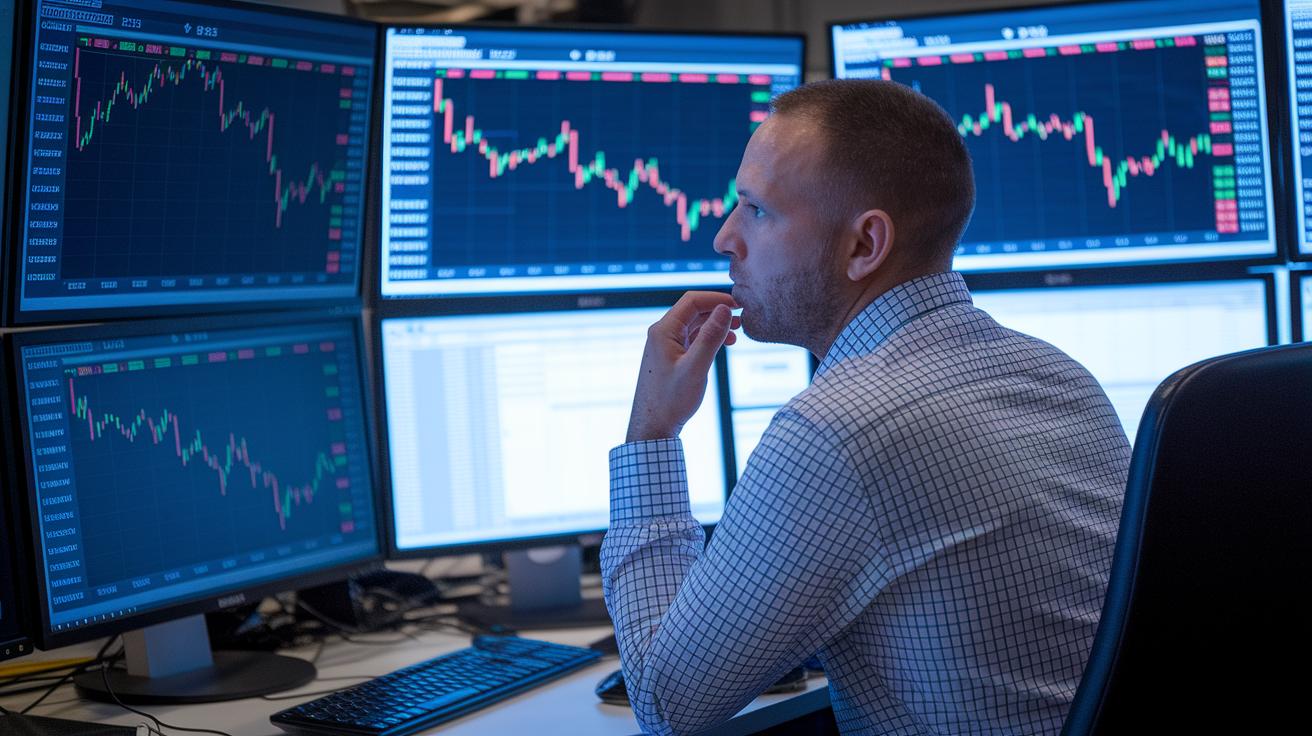
Have you ever noticed how those early trades give a little hint of what might come? From 4:00 AM to 9:30 AM ET, premarket trading lets both big players and everyday investors match orders on ECNs (electronic trading networks that quickly connect buyers and sellers).
Even though there aren’t as many orders, just a few small trades can push prices up or down in a flash. It’s like a sneak peek into the day’s rhythm, boosting liquidity (how easily something can be bought or sold) and setting the tone for the trading day ahead.
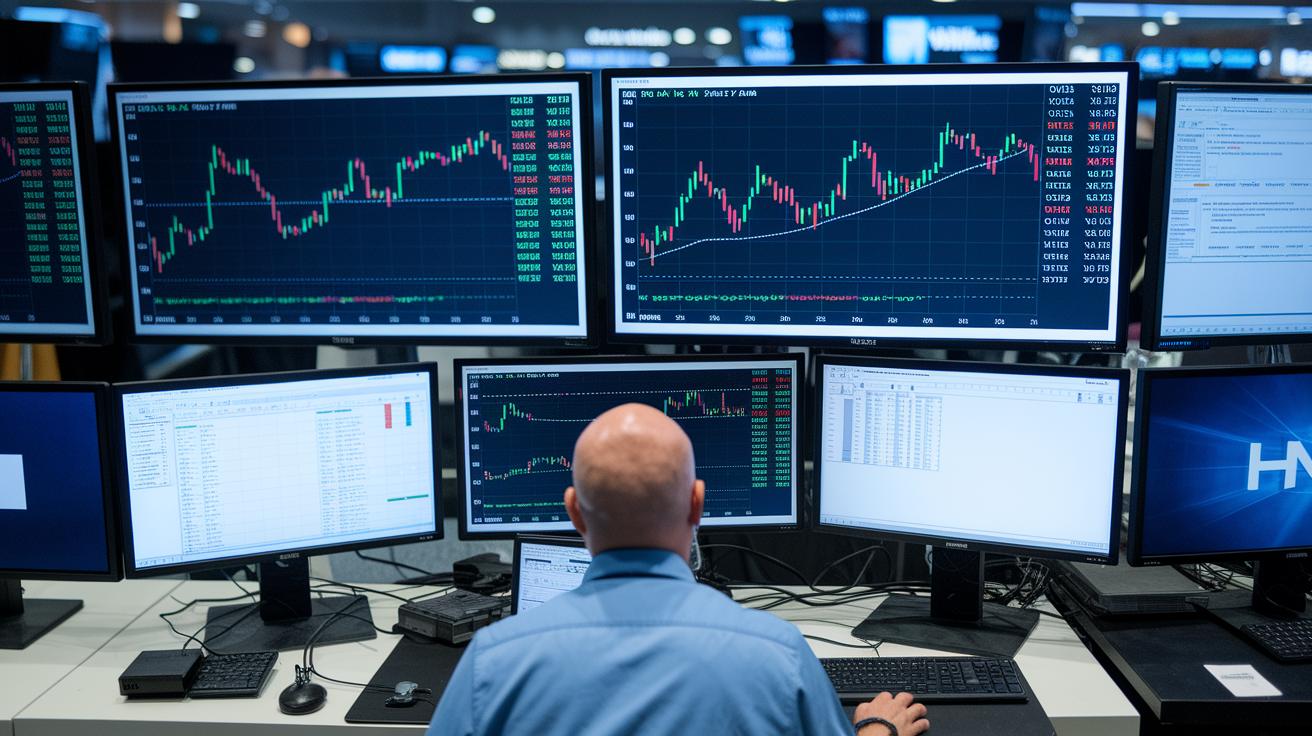
Premarket Trading Energizes Market Liquidity and Prices

Premarket trading gets the day started on exchanges like NASDAQ and NYSE, running from 4:00 AM to 9:30 AM ET. During these early hours, both big institutions and everyday investors use special systems called ECNs (electronic communication networks, which simply help match buy and sell orders) to place their limit orders. Basically, this time is all about figuring out what the opening price might be.
Even though premarket trading sets the stage, it has lower liquidity (how easily you can buy or sell an asset) than regular trading hours. That means orders might be filled with bigger gaps between what buyers are willing to pay and what sellers want. And if a large order comes in suddenly, prices can jump or drop quickly. Many traders keep a close eye on these early moves to understand how the market might feel once the regular session begins.
A lot of investors like premarket trading because it gives them a sneak peek of the expected opening. By watching order flows and the way orders are matched through ECNs, they can spot potential price gaps and plan their trades better. Most of the orders in this time are limit orders, which help avoid slippage (the risk of executing a trade at a different price than expected) when trading is slow.
In short, premarket trading plays a key role in setting the tone for the day. It helps discover opening prices, energizes market liquidity, and lays the foundation for the price moves that follow.
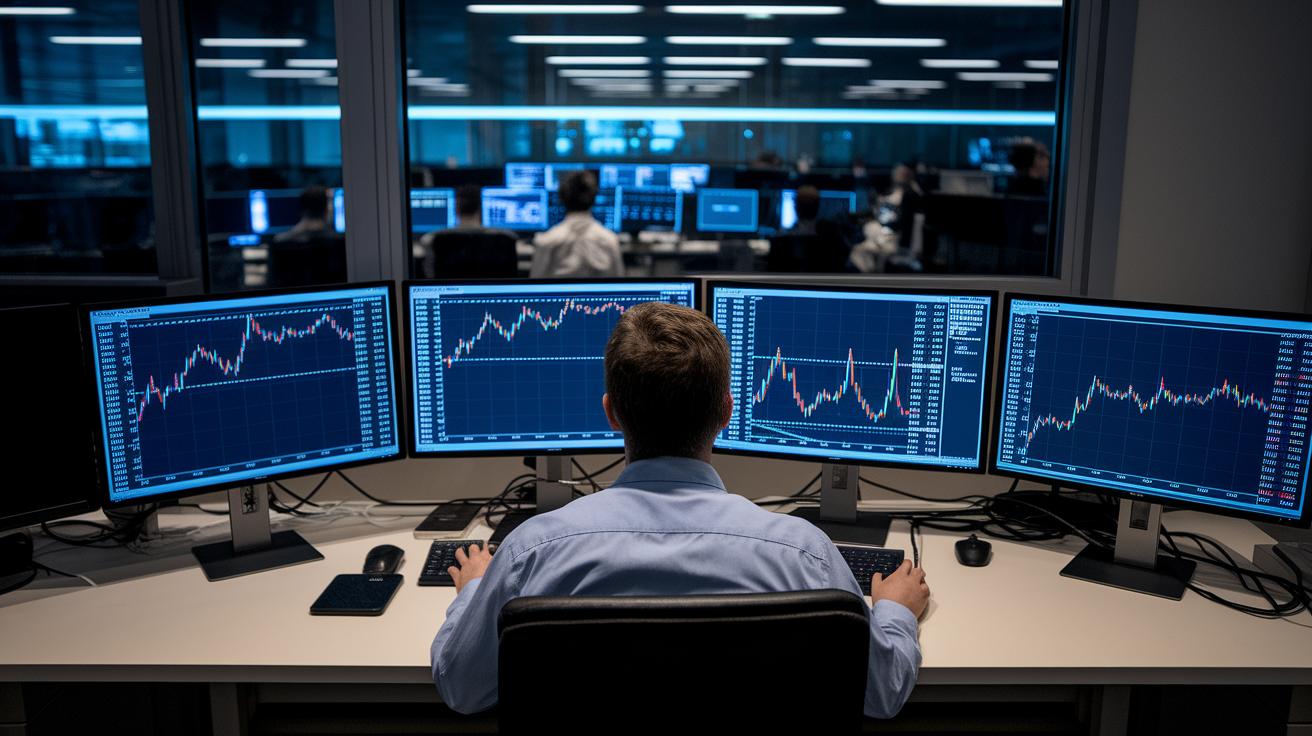
Assessing Liquidity and Volume Dynamics in Premarket Trading
Premarket liquidity hints at how busy the market might get once regular trading begins. Early in the day, only 5% to 20% of the usual volume gets traded. This thinner trading can cause the gap between buying and selling prices to widen two to four times more than normal, so even modest orders can shift prices noticeably.
Take a closer look: big names like AAPL and TSLA sometimes trade over a million shares before the open. It’s pretty striking because, while overall trading is light, these select stocks light up with activity. Even a small order can trigger a price change, and traders watch these moments closely. They compare current spreads to past averages to better grasp how much liquidity there is.
Premarket trading has its own beat. Orders placed at this time are often the result of rapid decisions by both large institutions and everyday traders. So, keeping an eye on the bid-ask spread helps predict whether prices might swing wildly as the day starts.
| Exchange | Premarket Hours | Avg Volume (% Regular) |
|---|---|---|
| NASDAQ | 4:00 AM ET – 9:30 AM ET | 5% to 20% |
| NYSE | 4:00 AM ET – 9:30 AM ET | 5% to 20% |
This clear look at liquidity gives traders a solid base to understand and prepare for any potential price volatility before the market officially opens.
Premarket Trading Strategies and Entry Criteria
Imagine coming into a trading day and finding some stocks that open with a gap of more than 2%. When a stock jumps over 2% right at the start, it hints at a burst of energy that might lead to a strong move later. Think of it like this: before you even get to the headlines, some stocks announce themselves with an explosive gap that grabs your attention and signals potential profit.
Traders look for clear entry signals. They check tools like the RSI (which shows if the stock is too hot or too cold) on a 5-minute chart and watch the MACD histogram turning positive. These early cues help signal that something big might be in the works. It’s like noticing the first drops of rain before a storm hits.
Volume is another big clue. A steady flow of trades, verified by the premarket VWAP (a fancy way of saying the average price where most trading happens), helps traders decide if a gap is just a fluke or part of a bigger trend. Some even watch for stocks moving over 4% past the previous close. When that happens, a few traders might even bet on the price backing down after the extreme jump.
For those who want to dig even deeper into these trading moves, there’s a detailed guide on “day trading strategies” available at https://cipherstonk.com?p=320.
In a nutshell, combining gap moves, momentum signals, and volume checks creates a solid plan for making informed premarket entries.
Risk Control and Volatility Forecasting in Premarket Trading
Premarket trading can feel like a roller coaster. Prices tend to move about 30% more than normal trading hours, which means everything can change very quickly. Traders often turn to tools like the ATR on 5-minute bars (a measure that shows how much prices typically move over a short period) to catch these shifts. It’s almost like listening to the market’s heartbeat at a super charged moment.
Managing risk is really important here. Many traders only risk about 1% of their portfolio on a single trade. In practice, they set stop-loss orders at roughly 1.5 to 2 times the premarket ATR. Picture it this way: if you buy a stock when the market is buzzing, you’d set your stop-loss just past the range where prices might pull back, keeping a safeguard in place.
Traders also watch every minute-by-minute price change and study past trends, kind of like checking the weather before you head out. This hands-on approach helps them understand market movements and make smarter, risk-adjusted decisions.
By mixing these methods, traders turn wild, early market swings into manageable opportunities. Balancing risk control with careful volatility monitoring transforms the unpredictable nature of premarket trading into a strategic advantage.
Broker Platforms and Order Execution Precision for Premarket

Broker platforms help get your orders done fast and right during early trading hours. For instance, Interactive Brokers accepts orders from 4:00 AM ET. This lets you quickly set a limit order, with the system working hard to process it even if there aren’t many buyers or sellers. On the flip side, TD Ameritrade only starts accepting orders at 7:00 AM ET, so you need to plan your trades carefully.
Limit orders are the popular choice at this time because they can keep your trade prices steady, avoiding something called slippage (which is when trades happen at prices you didn’t expect). Also, some brokers don’t allow fancy order types, like stops or trailing stops, until the regular market opens. This way, traders can focus on the platform’s easy-to-use features that deliver fast, precise order execution.
Imagine needing to grab a trade and seeing the platform spring into action at the drop of a hat, every second really does count in these early hours. Quick routing of orders can be a game changer when market conditions shift, ensuring every trade you plan goes through smoothly.
Economic Announcements and Earnings Impact on Premarket Movements
Big economic news can stir up premarket trading in an instant. At 8:30 AM ET, key data like Fed rate decisions, CPI, and unemployment numbers are released. Understanding the current Fed rate (check out the latest fed funds rate) helps explain how these announcements affect market liquidity. The news hits fast and traders start adjusting their positions, expecting quick price swings.
Around 70% of S&P companies share their earnings before the market officially opens. These early reports can cause price gaps of 3% to 10%. This kind of move gives traders a clear sign to follow the trend or prepare for a change. In simple terms, the mix of corporate earnings and scheduled economic news makes a big impact on early trading moves, guiding every decision.
| Event | Time ET | Typical Price Move (%) |
|---|---|---|
| Fed Rate Decision | 8:30 AM | Up to 2% |
| CPI & Unemployment | 8:30 AM | 3-5% |
| Earnings Reports | Premarket | 3-10% |
In a nutshell, these economic and earnings announcements work together to steer the early market moves, helping traders decide when to enter or exit positions.
Technical Chart Examination and Momentum Indicators in Premarket Trading

Traders often kick off their day by glancing at 5- and 15-minute candlestick charts. They look for simple patterns like morning stars or hammers, which can hint that buyers are starting to take charge. It’s a bit like spotting the first signs of a drumbeat before the full band starts playing.
Another key signal is the EMA crossover. When the 5-period EMA moves above the 20-period EMA, many traders see this as a sign that momentum is shifting. Imagine watching a strong river current gather speed, it’s a clear reminder that a price move might be coming. Plus, when volume spikes to more than 1.5 times the usual amount, it confirms that this isn’t just a quick blip; it’s part of a larger change in market mood.
Some traders like to use an opening range breakout. They use the first three 5-minute bars to set clear entry and exit points. This method helps cut through all the noise, making it easier to see a true trend. For a more detailed view, check out day trading chart patterns to see how visual setups guide premarket moves.
Final Words
In the action, we explored the basics of premarket trading, from defining the session hours and liquidity dynamics to highlighting key entry strategies. We broke down how risk control, platform precision, and economic announcements affect your trades. We even touched on technical chart setups to help interpret market signals. This guide brings together real-world insights and practical tips, so you can feel more confident stepping into volatile sessions. Keep these insights in your toolkit, and move forward with a positive, informed mindset.
FAQ
What is premarket trading and when does it occur?
Premarket trading refers to buying and selling stocks before the regular market opens, typically between 4:00 AM and 9:30 AM ET on exchanges like NASDAQ and NYSE using electronic systems.
How is liquidity and volume different in premarket trading?
In premarket sessions, liquidity is lighter and trading volumes are only 5% to 20% of regular hours, with bid–ask spreads that can widen up to four times normal levels, affecting trade pricing.
What strategies can traders use to enter premarket trades?
Traders may use gap-and-go setups when stocks open with a price gap, monitor momentum through indicators like RSI and MACD, and reference premarket VWAP to confirm volume trends before entering a trade.
How can traders manage risk during volatile premarket sessions?
Traders limit risk by setting stop-loss orders based on premarket volatility, often using a multiple of the ATR calculated on short-term charts and restricting exposure to a small portion of their portfolio per trade.
What should traders look for in broker platforms for premarket trading?
Look for platforms that offer early order submissions with advanced routing controls and reliable execution, as some brokers set different start times and may limit order types to ensure precise order fills.
How do economic announcements and earnings impact premarket price movements?
Economic releases and earnings reports drive significant price shifts before the market opens, as many companies report results early, causing noticeable gaps as traders adjust their positions based on this data.
What technical indicators are useful when analyzing premarket trading charts?
Traders use candlestick patterns, EMA crossovers, and volume spikes on short-term charts to identify momentum shifts and set thresholds with opening range breakout strategies during premarket analysis.