


Ever wonder if your stock charts might be hiding clues for smarter trades? Candlestick patterns turn regular market data into little signals about who’s in control. Each colored candle shows a short story of highs and lows, offering hints that can help you make better trading moves.
With just a quick look, these patterns can alert you to early signs of a market shift. It gives you a clearer picture of where trends might be headed. In a way, it’s like reading an open letter to your portfolio.
How Stock Candlestick Patterns Reveal Market Sentiment

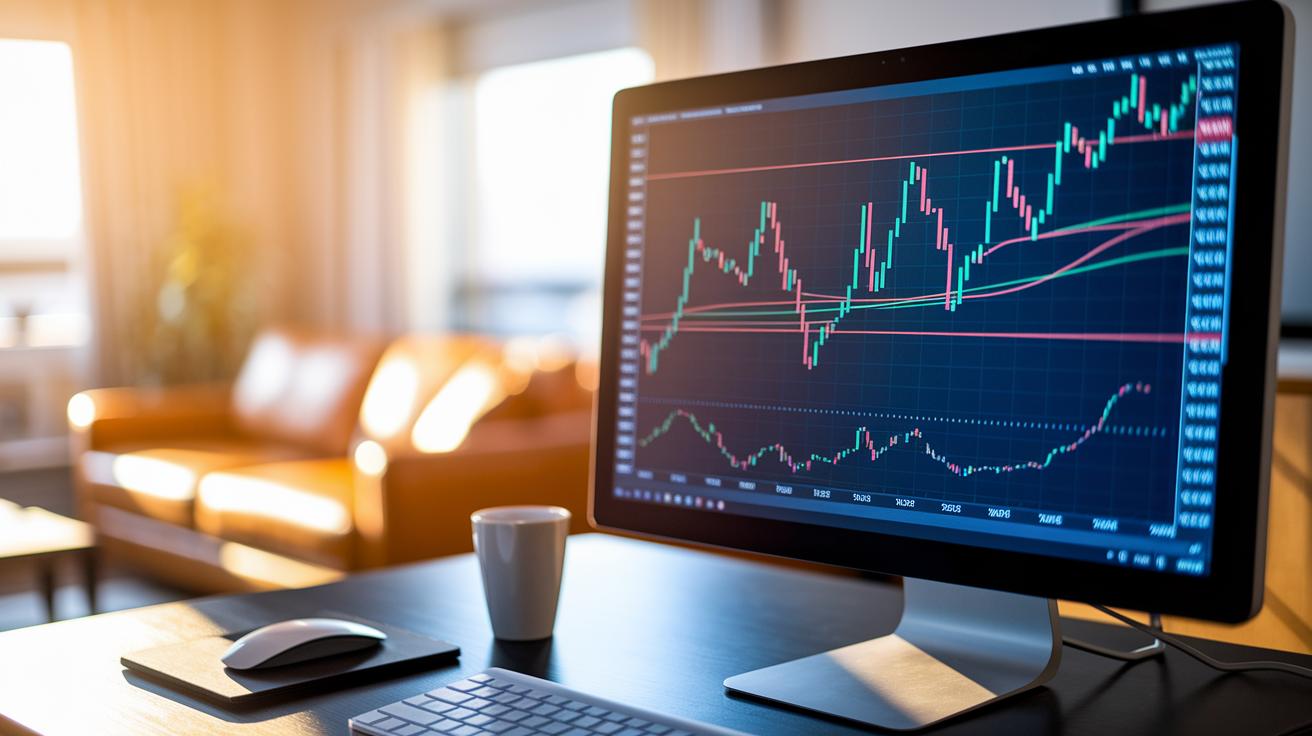
Candlestick charts let you see market action at a glance. They use a simple picture where each candlestick shows the opening and closing prices in its body, while the thin lines (or shadows) mark the highest and lowest prices during a set time. In short, these details give you a quick look at what’s happening in the market right now.
The chart's colors speak volumes, too. When you see a green candlestick, it usually means buyers are in control, pushing prices higher. On the flip side, a red candlestick tells you that sellers are taking charge and driving prices down. This clear color code helps traders quickly feel out the current market vibe.
Candlestick patterns work like a window into the battle between supply and demand. By checking the shape, size, and color of each candle, you can spot early hints that a trend might change direction or keep on going. And when you mix these clues with other signals, as seen in comprehensive market sentiment analysis, it gives you an edge in tweaking your trading strategy. Simply put, reading these patterns is a solid way to use technical analysis to make smarter trading decisions.
Anatomy of a Stock Candle Formation

Each candlestick is like a simple snapshot that breaks down market moves into easy-to-see parts. It shows how prices shifted during a session. The body marks where prices started and ended, while the wicks point out the session’s highest and lowest points.
- Body: This is the thick part that displays the open and close prices, giving you a quick look at whether buyers or sellers had the edge.
- Wicks: These slim lines, found above and below the body, capture the highest and lowest prices reached during the trading day.
- Doji: Sometimes you’ll notice a candle where the open and close are almost the same. This signals market indecision, like a pause before a change.
- Marubozu: A long-bodied candle with little to no wicks usually shows a strong push in the current trend.
- Color Conventions: Generally, green or white candles point to a bullish (upward) move, while red or black candles suggest a bearish (downward) trend.
Understanding these elements is key to recognizing patterns on stock charts. Many traders study these details closely to spot signals that might hint at a change in market mood. Every part, from the clear body to the stretching wicks, helps you read market behavior and build a strategy with confidence.
Top Bullish Reversal Candle Setups
Bullish setups give traders a good hint that things might be changing. They show when buyers could start pushing prices up, especially when the market has been shaky or in a downtrend.
- Hammer & Inverted Hammer: Think of a small candle with a long lower tail at the bottom of a downtrend. It shows that buying interest is beginning to grow.
- Bullish Engulfing: This is a big green candle that completely covers the previous red candle. It tells us that buyers have taken control.
- Morning Star: This pattern uses three candles, a down candle, a small candle that shows doubt, and a strong up candle. Together, they hint at a market turnaround.
- Three White Soldiers: Here, you see three strong bullish candles in a row, each building on the last. It’s a clear sign that buyers are gaining strength.
- Three Outside Up: Known for being reliable, this pattern has been seen on assets like Bitcoin in 2024. It marks a clear shift from selling to buying.
Before jumping in, traders like to double-check these patterns. They might look for higher trading volume (more shares moving hands quickly) or other technical clues like trendlines and support levels. They often wait for another candle to confirm the upward move to help avoid false signals. In short, confirming the pattern helps make sure the trade fits with the overall flow of the market.
Key Bearish Reversal Candle Techniques

When you’re watching a candlestick chart, noticing bearish signals can really help you avoid losses in a downtrend. It means that when sellers begin to take control, the chart starts to show signs of a possible reversal or that buyers might be selling to take profits. Recognizing these hints means you know when a trend could be changing, and it might be time to review your trading strategy.
- Hanging Man: Imagine a tiny candle body with a long lower wick at the top of an uptrend. This tells you that buyers might be stepping back and that profit-taking could be happening.
- Dark Cloud Cover: This pattern shows up when a bearish candle closes below the middle point of the previous bullish candle. It’s a clear sign that sellers are beginning to take charge.
- Evening Star: Look for a three-candle pattern where a bearish candle follows a small indecisive one. This setup can signal that a reversal is on the horizon.
- Three Black Crows: Here, three long bearish candles come in a row. Each one builds on the last, pointing to growing selling pressure and a strong downward move.
- Doji at Trend Peak: This candle almost closes at the same price it opened, showing trader hesitation. When the next candle is bearish, it can be a warning that a reversal is coming.
For anyone managing risk, it’s smart to confirm these bearish signals by checking other tools like volume (how much of a security is being traded) or momentum (the speed of price changes). And, placing stop-loss orders just above recent highs can help shelter you from sudden market flips. Using these techniques together builds a sturdy shield, cutting down the risk from surprises in market moves.
Integrating Candle Signals into Trading Strategies

Start by checking the patterns that appear on your chart. Many traders mix candlestick signals with support and resistance levels to get a clearer view of market strength. Daily charts tend to smooth out the noise, while shorter charts (like 5–15 minutes) might show more signals, but they can sometimes be false alarms. A simple step is to back up these signals with tools like volume analysis (which tells you how many shares are being traded) or the RSI (a gauge of buying and selling pressure). This kind of blend helps you avoid making quick, impulsive decisions.
Next, fine-tune your method by testing it on the timeframes you prefer. Whether you're day trading or planning longer-term moves, matching signals with the right indicators is key. Don’t fall into the trap of looking at one signal in isolation; always check for extra confirmation. Regularly backtesting your strategy, mixing candlestick patterns with tools like the RSI, can boost your confidence and guide you to better entry points.
- Spot the trend: Take a wide look at the chart to see the overall market direction.
- Look for patterns: Find classic candlestick shapes that might hint at reversals or continuations.
- Double-check with volume or RSI: Check for volume spikes and RSI readings to see if the pattern is strong.
- Plan your entry and exit: Set clear points for when to enter and exit trades based on recent support or resistance levels.
Keeping a trading journal for these signals is a smart move. Write down the date, the chart conditions, and exactly which signals caught your eye. This habit not only shows you what worked but also sharpens your ability to spot quality patterns over time. Reviewing your trades helps you fine-tune your strategy, making sure each signal fits into a broader, well-thought-out trading plan. Every trade becomes a lesson that sharpens your market analysis skills.
Advanced Methods and Backtesting for Candle Chart Analysis

Algorithmic detection now makes it easier to spot patterns across different timeframes. By comparing daily and hourly charts, traders can cut through market noise and zero in on clear signals even when the market's all over the place. It’s like tuning a radio to just the right frequency so you can hear the soft hum of a trend amid the static.
Studies from the Taiwan Stock Exchange and Japan's Nikkei 225 show that mixing candlestick patterns with predictive models really raises the accuracy bar. Backtesting using historical data helps check how reliable these patterns are, making sure false signals are kept in check. Think of it like replaying a game to learn from every move, it fine-tunes your entry and exit strategy so that raw price data turns into clear, actionable insights.
Adding analytics tools to the mix boosts the overall strategy. Simple tools like spreadsheets or data visualization software work hand-in-hand with algorithmic models to give you a more vivid picture of market behavior. This extra confirmation turns what might just be a pattern into a solid, data-backed trading decision.
Final Words
In the action, we broke down how stock candlestick patterns reveal market sentiment through clear visual components and color cues. We examined setups that hint at bullish trends and cautioned about bearish signals. We also discussed combining these insights with solid market strategies and refined analysis techniques.
This guide shows how every pattern plays a part in shaping a smart investment plan. Keep using stock candlestick patterns as your tool for building a confident, informed approach to the market.