


Ever get the feeling your trade plan is missing a little something? Imagine if simple, clear math could guide you to better wins. The day trading calculator gives you a quick look at your risk and reward. Just enter your starting amount, win rate, and daily risk, and watch it break the numbers down like a trusted friend. It paints a clear picture, helping you fine-tune your setups for smoother, more confident wins.
Get Instant Results with the Day Trade Calculator Dashboard

This dashboard gives you a quick snapshot of your trade's potential by letting you enter basic info like how much money you start with, your win rate, risk-reward ratio (how much you might gain compared to what you risk), daily risk, and how many days you plan to trade. It takes all those numbers and neatly turns them into easy-to-understand details. For instance, if you enter a 60% win rate and a 1:2 risk-reward ratio, it immediately shows you how those figures can affect your profits and losses, helping you see if your setup is on track.
Once you’ve entered your data, the tool calculates what you might earn each month and displays the results in numbers. If you’re a registered user, you also get a visual graph showing a smooth curve that maps out your potential growth over time. This lets you quickly check your profit trends over a month and even adjust your position size for better results. It’s like having a friendly guide that helps you tweak your strategy and manage risks more wisely.
Remember, though, that the calculator doesn’t include extra charges like commissions, trading fees, or taxes. And if you haven’t registered, some cool features, like seeing the graph, won’t be available. So, think of this tool as a handy starting point for refining your plan. Always keep in mind to add in those extra costs and real market conditions when you’re making your final decisions.
Key Inputs in a Day Trading Calculator

This dashboard is a handy tool that brings together five key elements to help you understand your trading potential each day. It looks at the basics and also sets aside space for the commission costs on each trade and even hints at how taxes on quick profits might play a role.
- Starting capital (for example, $10,000)
- Win rate (say, a 60% success rate)
- Risk-reward ratio (for instance, 1:2)
- Daily risk limit (usually about 1–2% of your total money)
- Commission per trade and number of trading days
Try using real numbers, like risking 1–2% of your money daily with a starting balance of $10,000, to see how things might work out. Remember that fees and tax issues can change your final gains. For more helpful tips on managing risk and setting up your capital, check out day trading for beginners at https://cipherstonk.com?p=104.
Interpreting Your Day Trading Calculator Metrics
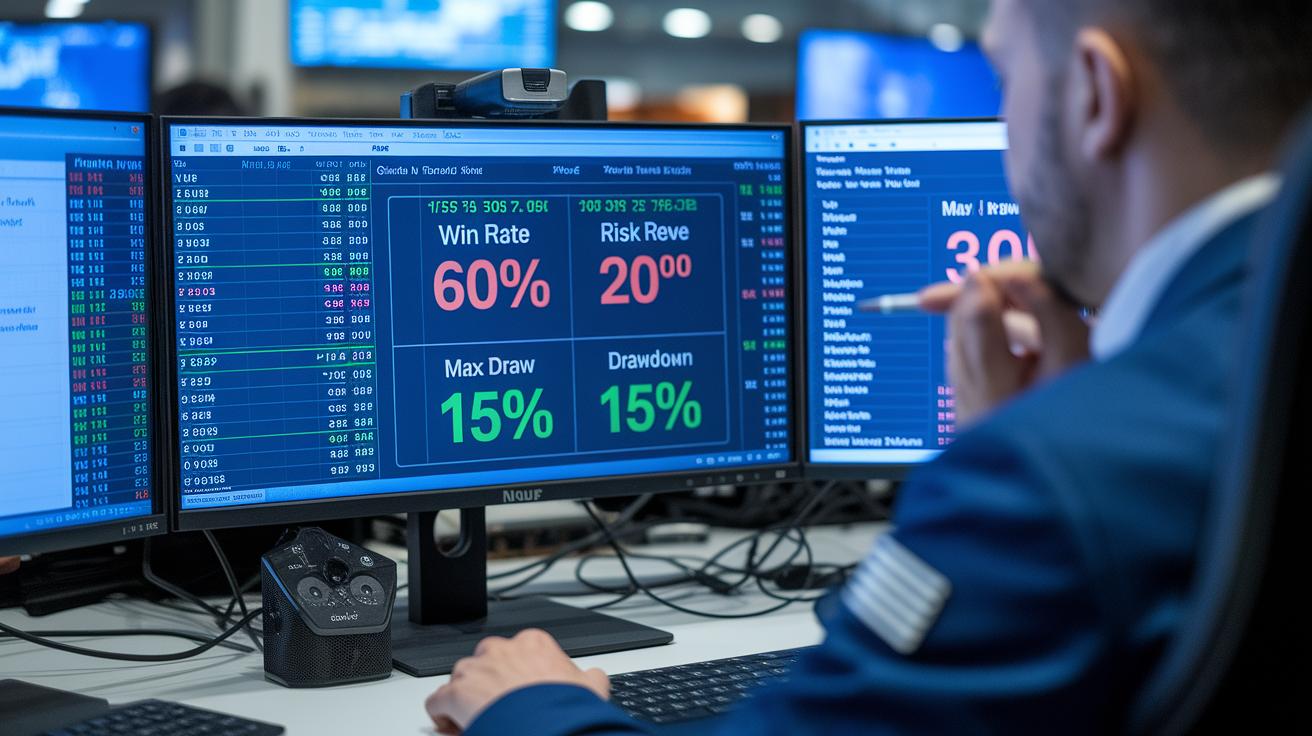
The day trading calculator shows three important numbers that help you see how well you're doing. First, there's the win rate, which tells you how many trades you won compared to the total number you made, like winning 6 out of 10 times gives a 60% win rate. Next, the risk-reward ratio shows how much you could earn for every dollar you risk, such as risking $1 to potentially gain $2. Finally, the maximum drawdown tells you the biggest drop your account took during a tough trading run.
These numbers really matter for deciding how much profit you might make and how to handle risk. A high win rate can point to steady gains, but it only tells part of the story. For example, using trades where you might earn twice what you risk means even a 60% win rate can work in your favor. Plus, watching your maximum drawdown helps you understand how low your account might go on a bad day, so you can set safer limits.
By keeping an eye on these numbers, you can fine-tune your trading approach. Adjusting things like your win rate target and risk-reward balance lets you see different profit possibilities and prepare for slower days. Checking these metrics regularly can signal when it's time to change your strategy, which can boost your overall performance while keeping your risk in check.
Advanced Risk Management Features in the Day Trading Calculator

Adding built-in risk management tools to your everyday trading routine can really change the game, especially when you’re sticking to a 1–2% daily risk limit. This tool helps you keep track of your margin needs and current leverage so that you know exactly how exposed your money is before each trade. It works quickly to show you both the dollar value and the percentage of your capital at risk. Remember, it doesn’t take commissions, fees, or taxes into account, but you can easily pair it with a short-term tax analyzer to cover those extra costs.
Active Risk Evaluator
This feature shows your daily risk in real-time, both as a dollar amount and a percentage of your funds. It’s a quick way to see if you’re biting off more risk than you should in one trading session.
Volatility Impact Gauge
This gauge figures out how sudden market moves affect your margin and drawdown. It gives you a clear look at how price swings might impact your ability to meet margin calls.
Leverage Quotient Tracker
This tracker keeps an eye on the ratio between the margin you’ve used and your available buying power, ensuring that your leveraged positions stay within safe limits.
Sticking to clear risk limits is key for consistent day trading over the long run. Use the Active Risk Evaluator to check your daily exposure, the Volatility Impact Gauge to spot any unexpected market shifts, and the Leverage Quotient Tracker to see how much of your capital is already committed. When these insights come together with practical limits, they help you fine-tune your strategy while keeping potential losses in check.
Scenario Analysis Using Your Day Trading Calculator

Using the day trading calculator to play with different win rates and risk-reward ratios shows you exactly how small tweaks in your strategy can impact both gains and losses. This neat tool acts as a quick profit estimator for your day trades and gives you a peek into what your returns might look like over a 20-day period. For instance, if you try a 50% win rate paired with a 1:2 risk-reward ratio, you’re taking a careful approach. But bumping it up to a 60% win rate with a 1:1.5 ratio, or even a daring 70% win with a 1:3 ratio, shows how different performance levels can change the balance in your trading account. It’s like having a mini simulation that predicts growth , helping you balance risk and reward even before you hit the live market.
| Scenario | Monthly Profit | Max Drawdown |
|---|---|---|
| Scenario A (50% wins, 1:2) | $2,000 | $100 |
| Scenario B (60% wins, 1:1.5) | $2,400 | $120 |
| Scenario C (70% wins, 1:3) | $3,500 | $80 |
By switching up these details, you can tailor your forecasts to match your own trading style and comfort with risk. Try changing the win rate, the risk-reward ratio, or even the number of trading days to see a range of possible outcomes. This hands-on tweaking helps you find the best setup for your trading plan and market outlook. It’s a casual way to build confidence, as every test sharpens your strategy and ensures that your trades are based on insights that truly fit your goals.
Final Words
In the action, we explored how the tool helps you see potential trade returns by setting key inputs and reviewing profit projections. We walked through setting up your capital, win rates, and risk-reward ratios, and even touched on active risk checks along with scenario testing. Breaking down these features makes it easier to understand your market performance in real time. Using the day trading calculator can give you a clearer view of trade outcomes and boost your confidence as you refine your market strategies. Happy trading and keep evolving your approach!
FAQ
What types of free day trading calculators are available for crypto, forex, and stocks?
The free day trading calculator lets you experiment with crypto, forex, and stocks by letting you input capital, win rate, and risk-reward data to see potential returns and risk metrics instantly.
How do trading profit calculators, trading strategy win rate calculators, and scalping trading calculators work?
The trading profit and strategy calculators help you estimate returns by combining your win rate and risk-reward ratio, while scalping calculators focus on short-term trades to determine rapid profit opportunities with precise data inputs.
What does a compound interest calculator do in a trading scenario?
The compound interest calculator shows how reinvested trading gains can grow your capital over time, giving you a clear view of potential earnings when profits feed back into future trades.
How does a risk-reward ratio win rate calculator impact trading outcomes?
The risk-reward ratio win rate calculator measures how your winning percentage paired with favorable risk-reward setups can boost overall profit projections, making it easier to plan and adjust your trading strategy.
What does the 2% rule in day trading mean?
The 2% rule means you risk no more than 2% of your capital on a single trade, helping keep losses manageable and protecting your account from significant drawdowns during a bad trading day.
Can you realistically make 1% a day through day trading?
Making 1% a day is feasible with careful position sizing and strict risk management, though market variability means results can differ. It requires discipline and consistent strategy adjustments.
What is the 3-5-7 rule of day trading?
The 3-5-7 rule sets guidelines for entry, hold, and exit decisions by using specific targets based on technical levels and trade duration, so traders can structure their moves effectively throughout the day.
Why is there a $25,000 minimum for day trading?
The $25,000 minimum is a regulatory requirement for pattern day traders, ensuring you have enough capital to cover potential losses and meet margin demands while actively trading.